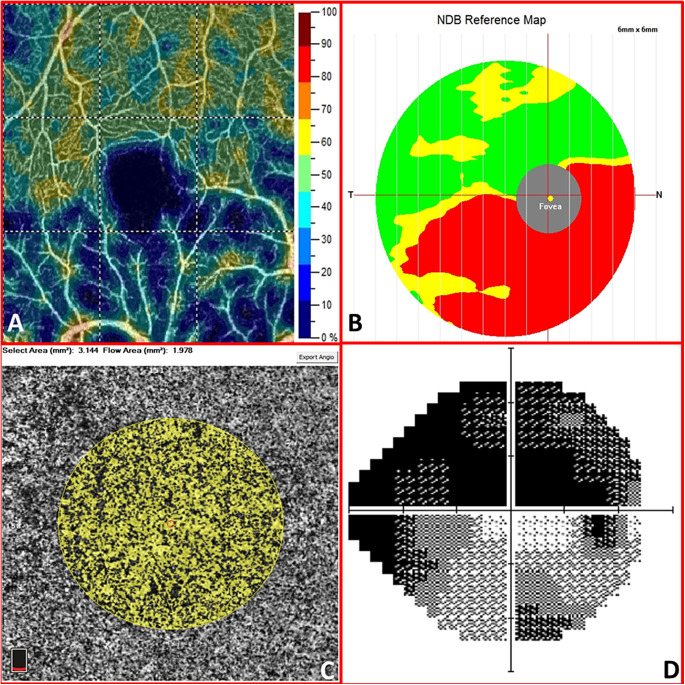
Figure 2.
The macular superficial capillary plexus vessel density map (A) and the macular choriocapillaris vascular perfusion area map (C) of the right eye in a 52-year-old man with advanced glaucoma. The hemi-inferior ganglion cell complex thickness (B) is reduced in respect with the normative data base (NDB). This reduction corresponds to a lower vessel density in the hemi-inferior parafovea sector and to the superior scotoma in the computed visual field (D). Mean deviation is −22.54 dB, and pattern standard deviation is 9.12 dB.

