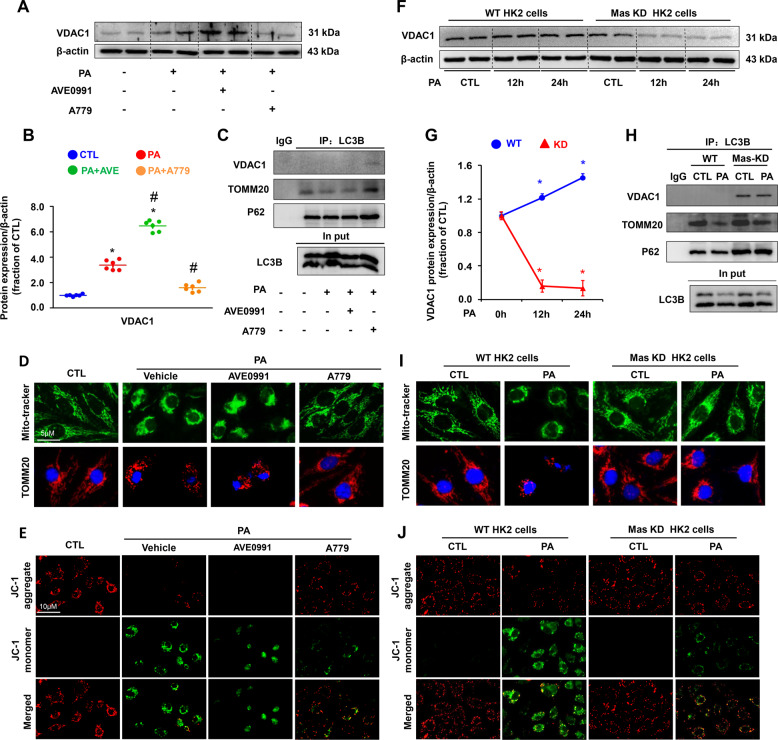
Fig. 6. Mas activation was associated with increased VDAC1 expression and impaired mitochondrial morphology and potential in HK2 cells treated with PA.
A and B Representative immunoblots and corresponding densitometry analysis of VDAC1 protein abundance in HK2 cells pretreated with AVE0991 or A779 followed by PA for 24 h. β-actin was used as a loading control. C VDAC1 and TOMM20 were detected by LC3 tag labeling in HK2 cells pretreated with AVE0991 or A779 followed by PA for 24 h. D Confocal microscopy images of Mito-tracker (green) and TOMM20 (red) in HK2 cells pretreated with AVE0991 or A779 followed by PA for 24 h. E Representative images of JC-1 staining showing JC-1 aggaregate (red) and monomer (green) in HK2 cells pretreated with AVE0991 or A779 followed by PA for 24 h. F and G Representative immunoblots and corresponding densitometry analysis of VDAC1 protein abundance in WT and Mas knockdown (KD) HK2 cells treated with PA for 12 h and 24 h. H Mitochondrial proteins VDAC1 and TOMM20 were detected by LC3 tag labeling in WT and Mas knockdown HK2 cells treated with PA for 24 h. I Confocal microscopy images of Mito-tracker (green) and TOMM20 (red) in WT and Mas knockdown HK2 cells treated with PA for 24 h. J Representative images of JC-1 staining showing JC-1 aggaregate (red) and monomer (green) in WT and Mas knockdown HK2 cells treated with PA for 24 h. WT, wild type; Mas KD, Mas knockdown Data are shown as mean ± SEM; *P < 0.05 compared with CTL; #P < 0.05 compared with PA. The experiment was repeated three times.

