Figure 4.

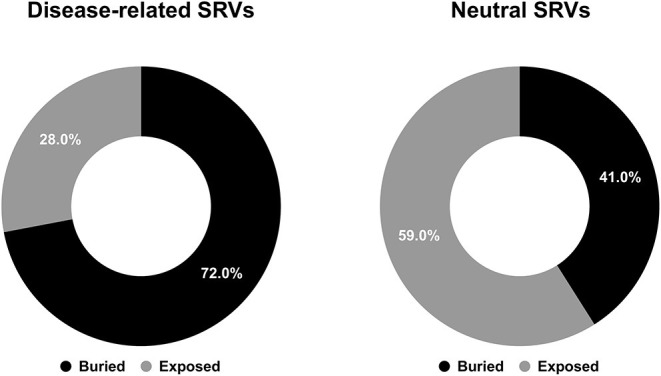
Pie charts showing the fractions of predicted buried/exposed positions disease-related (left) and neutral (right) upon variations in the HVARSEQ dataset, respectively.

Pie charts showing the fractions of predicted buried/exposed positions disease-related (left) and neutral (right) upon variations in the HVARSEQ dataset, respectively.