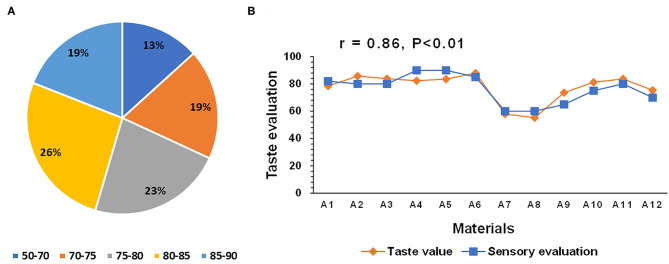
Figure 1.
Taste values of 400 hybrid rice varieties and 80 parental lines (A) and correlation between the sensory evaluation and taste value determined by a rice taste analyzer (B). (A) Different colors represents different taste value ranges. Percentage in each fan-shaped region represents the proportion of each taste value range. (B) Materials A1–A6 are conventional indica rice varieties. Materials A7–A12 are hybrid rice varieties.

