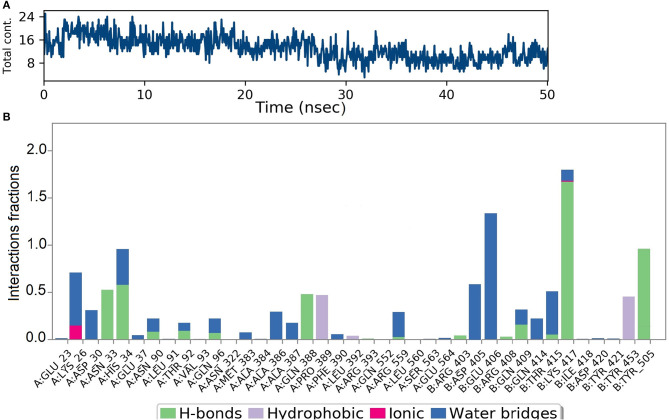
Figure 7.
Results of MD of NZO-SARS-CoV-2 S-protein-ACE-2 complex. (A) Timeline of the total contacts between NZO and SARS-CoV-2 S-protein-ACE-2 interface. (B) Stacked bar chart represents the normalized interactions throughout the trajectory. Y-axis represents the % of simulation time the specific interaction was maintained. Asn33 of ACE-2 receptor, chain A maintained hydrogen bond contact for 50% of the simulation time. Lys417 of the S protein, chain B, value above 1 indicates that it maintained multiple hydrogen bond contacts with the ligand throughout the simulation time.

