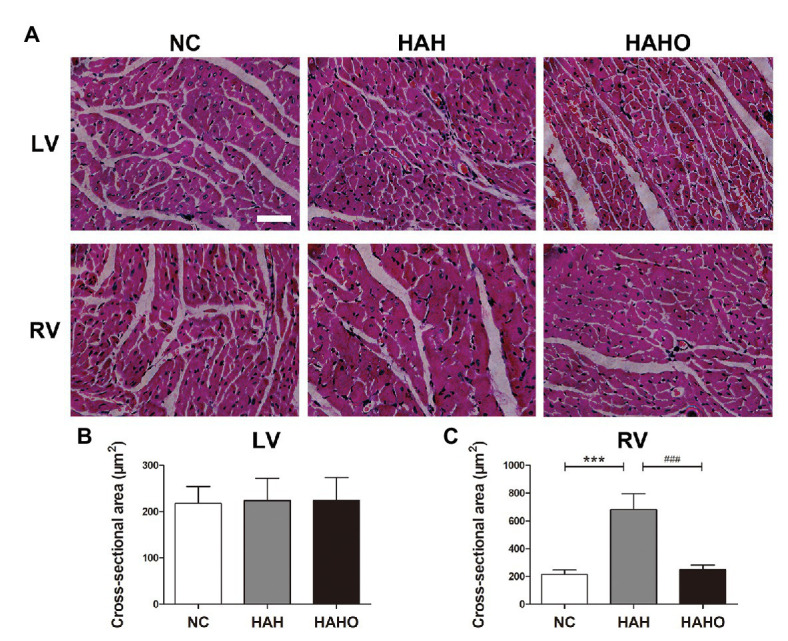
Figure 5.

Effects of local oxygen enrichment on the cardiomyocytes of rats exposed to 4-week hypobaric hypoxia according to the histological analysis. (A) H&E staining images of the cross-sections of the left ventricle (LV) and right ventricle (RV). Scale bars = 50 μm. (B,C) Statistical results of the cross-sectional area for the LV and RV cardiomyocytes. All data are expressed as mean ± SD (n = 6). NC, normal control group; HAH, high-altitude hypoxia group; and HAHO, high-altitude hypoxia with oxygen enrichment group. ***p < 0.001 vs. the NC group, ###p < 0.001 vs. the HAH group.
