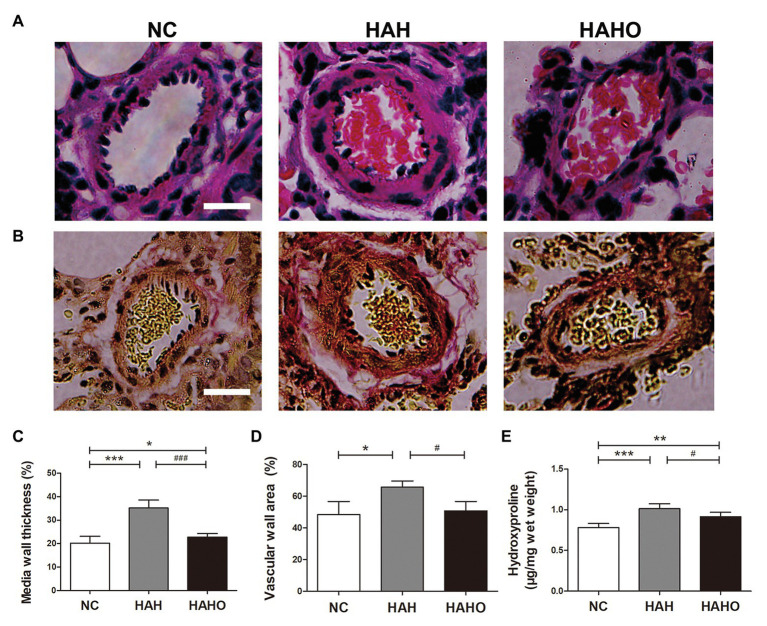
Figure 7.
Effects of local oxygen enrichment on the pulmonary arterioles of rats exposed to 4-week hypobaric hypoxia. (A,B) Representative H&E and Van Gieson (VG) staining images of pulmonary arterioles. Scale bars = 20 μm. (C,D) Statistical results of the percentage of medial wall thickness (MWT%) and percentage of vascular wall area (WA%). MWT% was calculated as [external diameter (ED) − internal diameter (ID)]/external diameter × 100%. WA% was calculated as [total vascular area (TA) − vascular lumen area (VA)]/TA × 100%. (E) Quantification of hydroxyproline concentration in lung tissues based on the alkaline hydrolysis method. All data are expressed as mean ± SD (n = 12). NC, normal control group; HAH, high-altitude hypoxia group; and HAHO, high-altitude hypoxia with oxygen enrichment group. *p < 0.05 vs. the NC group, **p < 0.01 vs. the NC group, ***p < 0.001 vs. the NC group, #p < 0.05 vs. the HAH group, and ###p < 0.001 vs. the HAH group.

