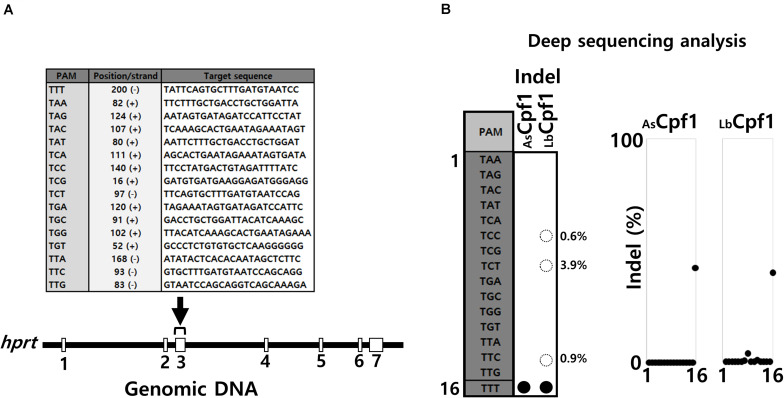
FIGURE 2.
Comparison of AsCPF1 and LbCpf1 PAM recognition by Deep sequencing analysis. (A) Target sequences: The sequences of the target hprt gene (exon3) are depicted in the table with the corresponding flanked 5′-TNNa-3′ sequences at the genomic sites. (B) NGS analysis: Deep sequencing analysis and indels frequency (%) observed for each guide RNA by AsCPF1 and LbCpf1 protein co-expression. The table on the right side summarize the Graph of the activity with the 16 guide RNA/5′TNNa-3′ for each protein. The expression vectors quantity was adjusted for both enzyme (AsCPF1 and LbCpf1) to obtain the same indels frequency with the optimal 5′-TTTa-3′guide RNA.

