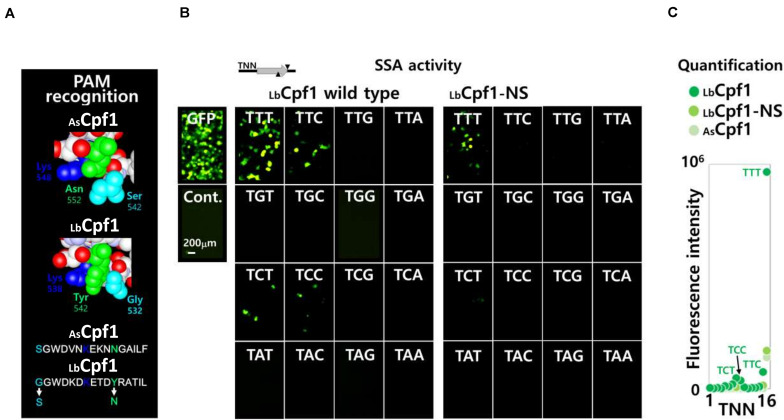
FIGURE 5.
Wt and mutant LbCpf1-NS PAM selectivity analysis using a 5′-TNNa-3′ library. (A) Structural representation of the PAM amino acids interacting on the major groove of the DNA: representation of both enzymes AsCpf1 (S542/K548/N552) and LbCpf1 (G532/K538/Y542). The mutant LbCpf1-NS (Y532S/K542N) correspond to an amino acids swap between the two protein species depicted bellow. (B) Image of fluorescent cells using a fluorescent microscope (×20): Fluorescent cells were inspected after transfection and 48 h incubation. The pictures show the fluorescent cells observed by co-transfection of the crRNA with Wt or NS mutant LbCpf1, together with the different pGFP-SSA 5′-TNNa-3′ vectors. 300 ng of the Cpf1 expression vectors were transfected for this experiment. The target site, represented on top of the pictures, is the same target sequence with the 16 different 5′TNNa-3′ sequences. The GFP, and a negative control, are depicted on the left side. (C) Graph of the quantification (Fluorescence intensity) of the fluorescent cells with the 16 constructs pGFP-SSA 5’-TNNa-3’ for each enzyme.

