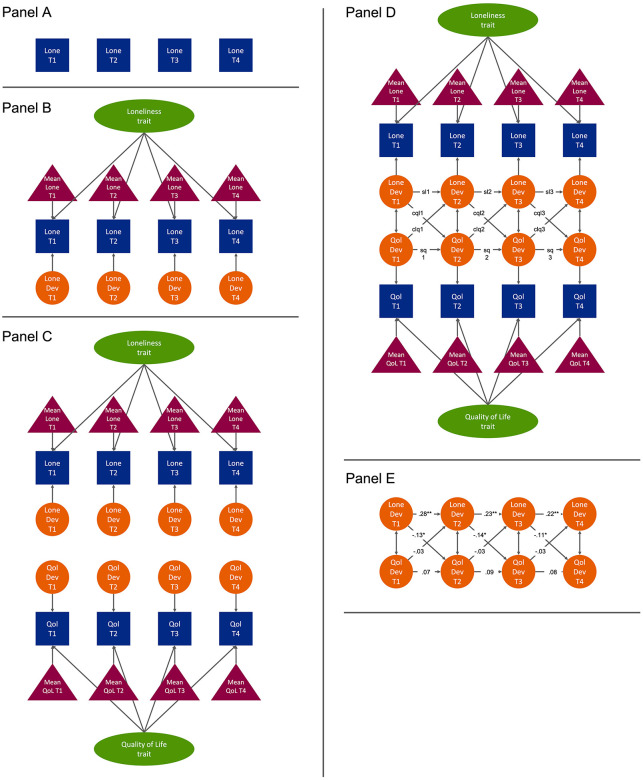
Figure 1.
Example of a random intercepts cross-lagged panel model with two variables (loneliness and quality of life) and four time points. Observed and latent variables are depicted by squares and circles, respectively. The group means are depicted by triangles. The covariances are depicted by double-sided arrows. For reasons of clarity, the residuals are not displayed.

