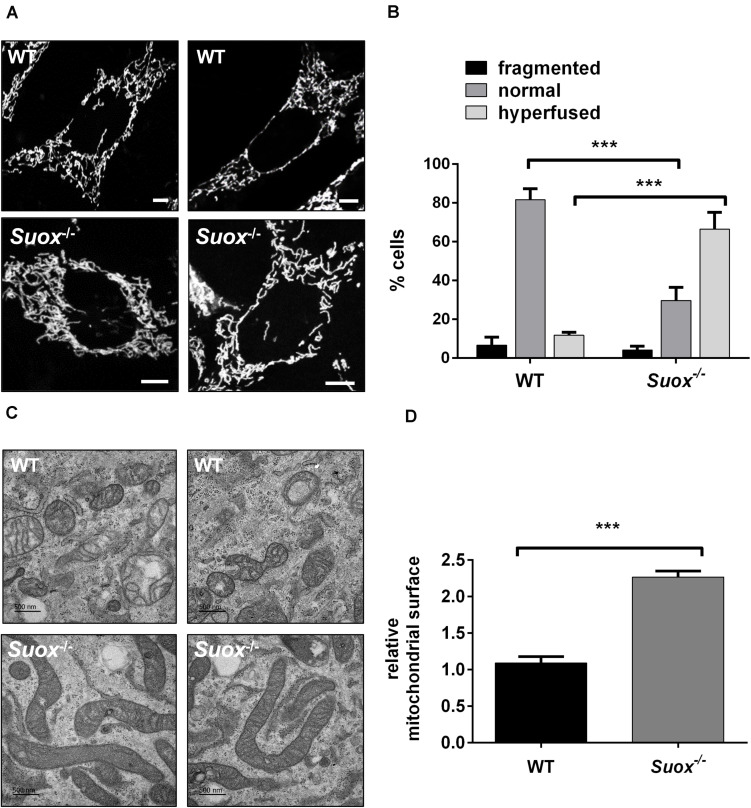
FIGURE 2.
Mitochondrial morphology in Suox–/– MEFs. (A) Visualization of the mitochondrial network in WT and Suox–/– MEFs. Mitochondrial networks in WT and Suox–/– MEFs were visualized by incubation in 200 nM MitoTracker Red CMXRos (Invitrogen) for 30 min at 37°C. Suox–/– MEFs show a more interconnected and elongated mitochondrial network than WT cells. Scale-bar represents 10 μm. (B) Quantification of mitochondrial network phenotypes in WT and Suox–/– MEFs presented in panel (A). 100 cells per genotype were categorized according to their mitochondrial network as either fragmented (disturbed, dot-like network, almost no tubules present), normal (both tubules and dot-like mitochondria present) or hyperfused (highly interconnected tubules, no dot-like mitochondria present) (n = 3). Error bars indicate standard deviation. Ordinary two-way ANOVA with Tukey’s post hoc test for pairwise comparisons was performed as indicated. p value: *** <0.001; ** <0.01; * <0.05; ns > 0.05. (C) Mitochondria captured from WT and Suox–/– MEFs via TEM. Suox–/– MEFs show highly elongated mitochondria compared to WT cells. Scale bar represents 500 nm. (D) Quantification of the mitochondrial surface area in WT and Suox–/– MEFs based on TEM pictures presented in (C). The surfaces of 50 individual mitochondria were measured with ImageJ and normalized to WT values (n = 3). Error bars indicate standard deviation. Student’s t test was performed as indicated. p value: *** <0.001; ** <0.01; * <0.05; ns > 0.05.

