Fig. 6.

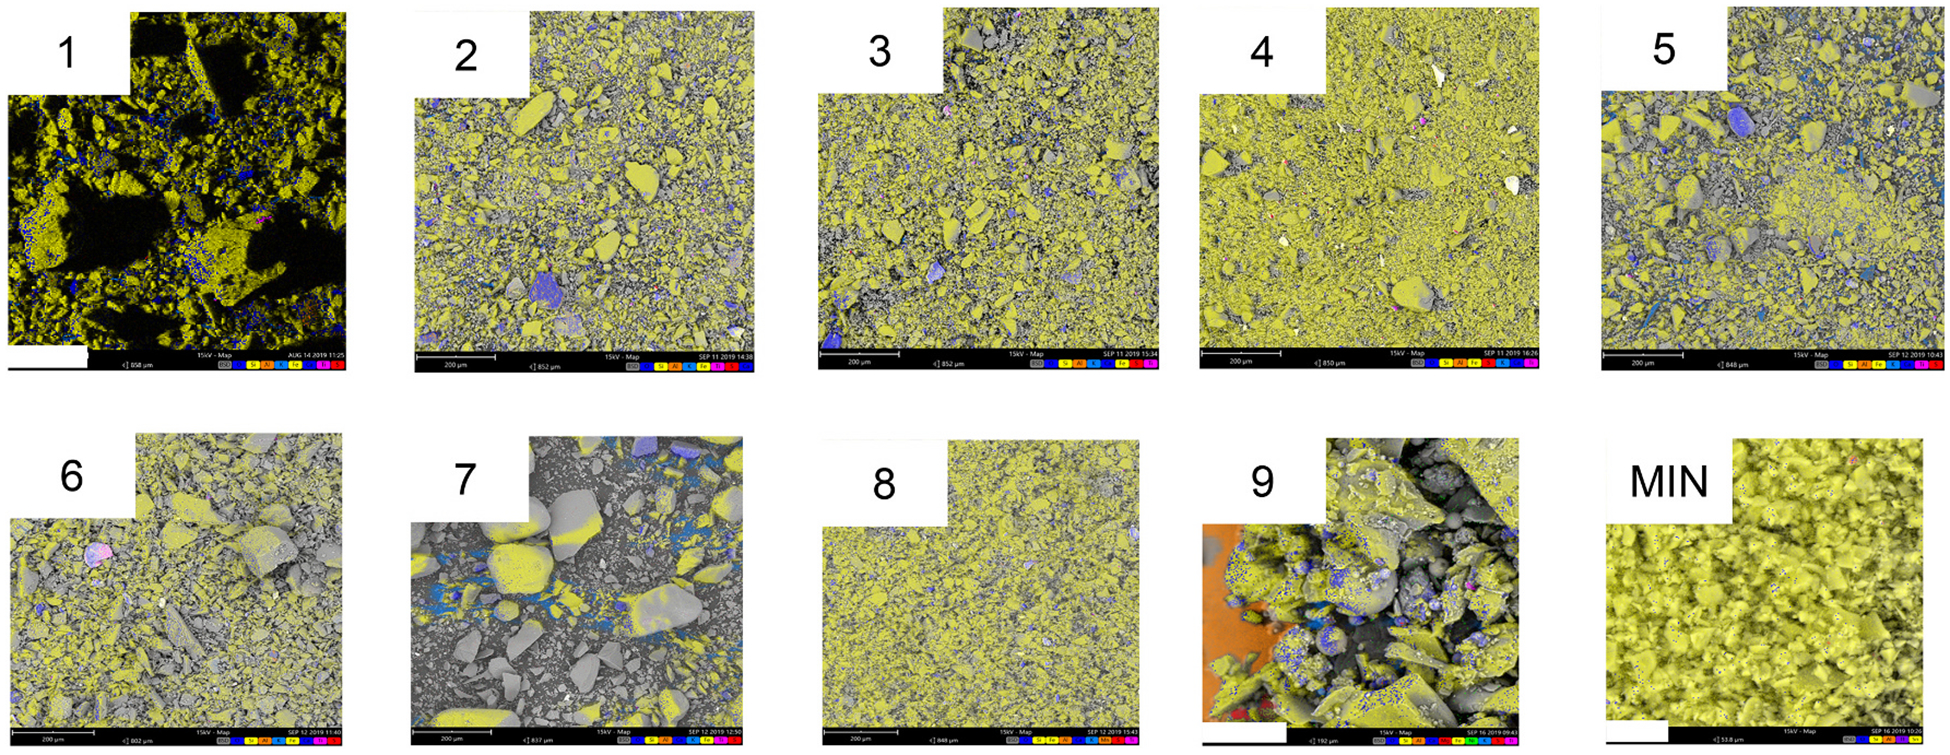
Composite EDS images of nine neat FSDs and MIN-U-SIL. These images depict the composite pseudo-colors of the samples. With amplification of the images different colors appear more clearly, reflecting the location of elements at different locations on the particles. For FSD 9 the orange area reflects the Al present in the mounting stub on which the particles were placed for analysis. The spectra for the individual elements comprising the composite in these samples may be viewed in Fig. S13.
Composite EDS images of nine neat FSDs and MIN-U-SIL. These images depict the composite pseudo-colors of the samples. With amplification of the images different colors appear more clearly, reflecting the location of elements at different locations on the particles. For FSD 9 the orange area reflects the Al present in the mounting stub on which the particles were placed for analysis. The spectra for the individual elements comprising the composite in these samples may be viewed in Fig. S13.
