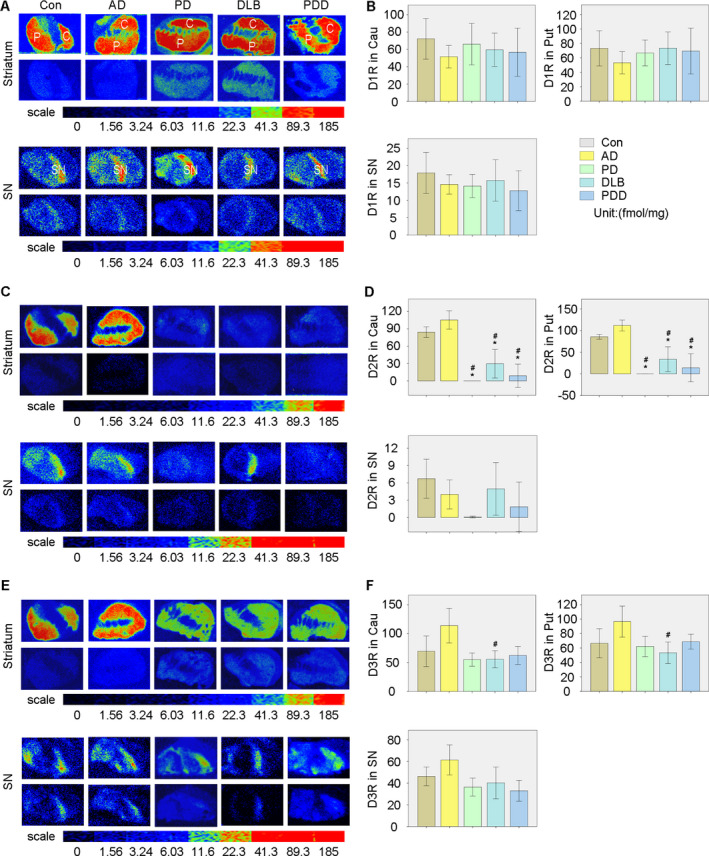
Figure 1.

Quantitative autoradiographic analysis of D1R, D2R, and D3R densities in the striatum and SN of all groups. (A) Autoradiograms of specific and nonspecific binding of [3H]SCH23390 in the striatum (upper panel) and SN (lower panel) of all groups. (B) Quantitative analysis of D1R densities among all groups. (C) Autoradiograms of specific and nonspecific binding of [3H]Raclopride in the striatum (upper panel) and SN (lower panel) of all groups. (D) Quantitative analysis of D2R densities among all groups. (E) Autoradiograms of specific and nonspecific binding of [3H]WC‐10 in the striatum (upper panel) and SN (lower panel) of all groups. (F) Quantitative analysis of D3R densities among all groups. *P < 0.05 versus Con, #P < 0.05 versus AD.
