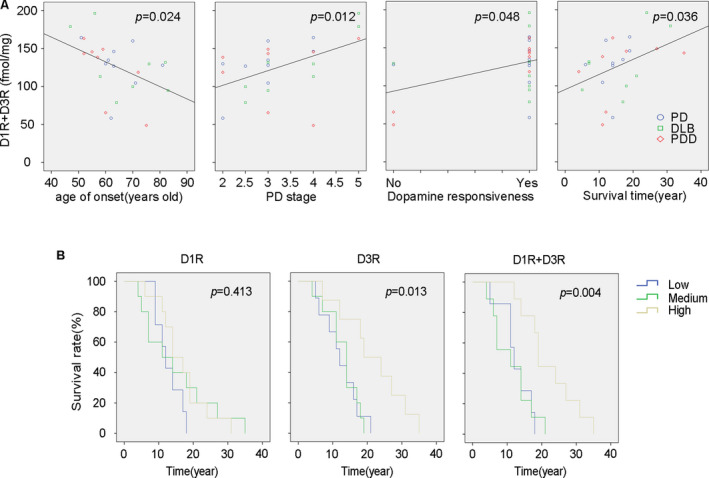
Figure 4.

Relationship between D1R + D3R density in the striatum with PD associated symptomatic and therapeutic features. (A) Linear regression analysis between D1R + D3R in the striatum with the age of onset, PD stage, dopamine responsiveness, and survival time are shown with R2 values of 0.160, 0.243, 0.203, and 0.178, respectively. (B) Kaplan–Meier survival curves of D1R, D3R, and D1R + D3R made with low, medium, and high‐density levels.
