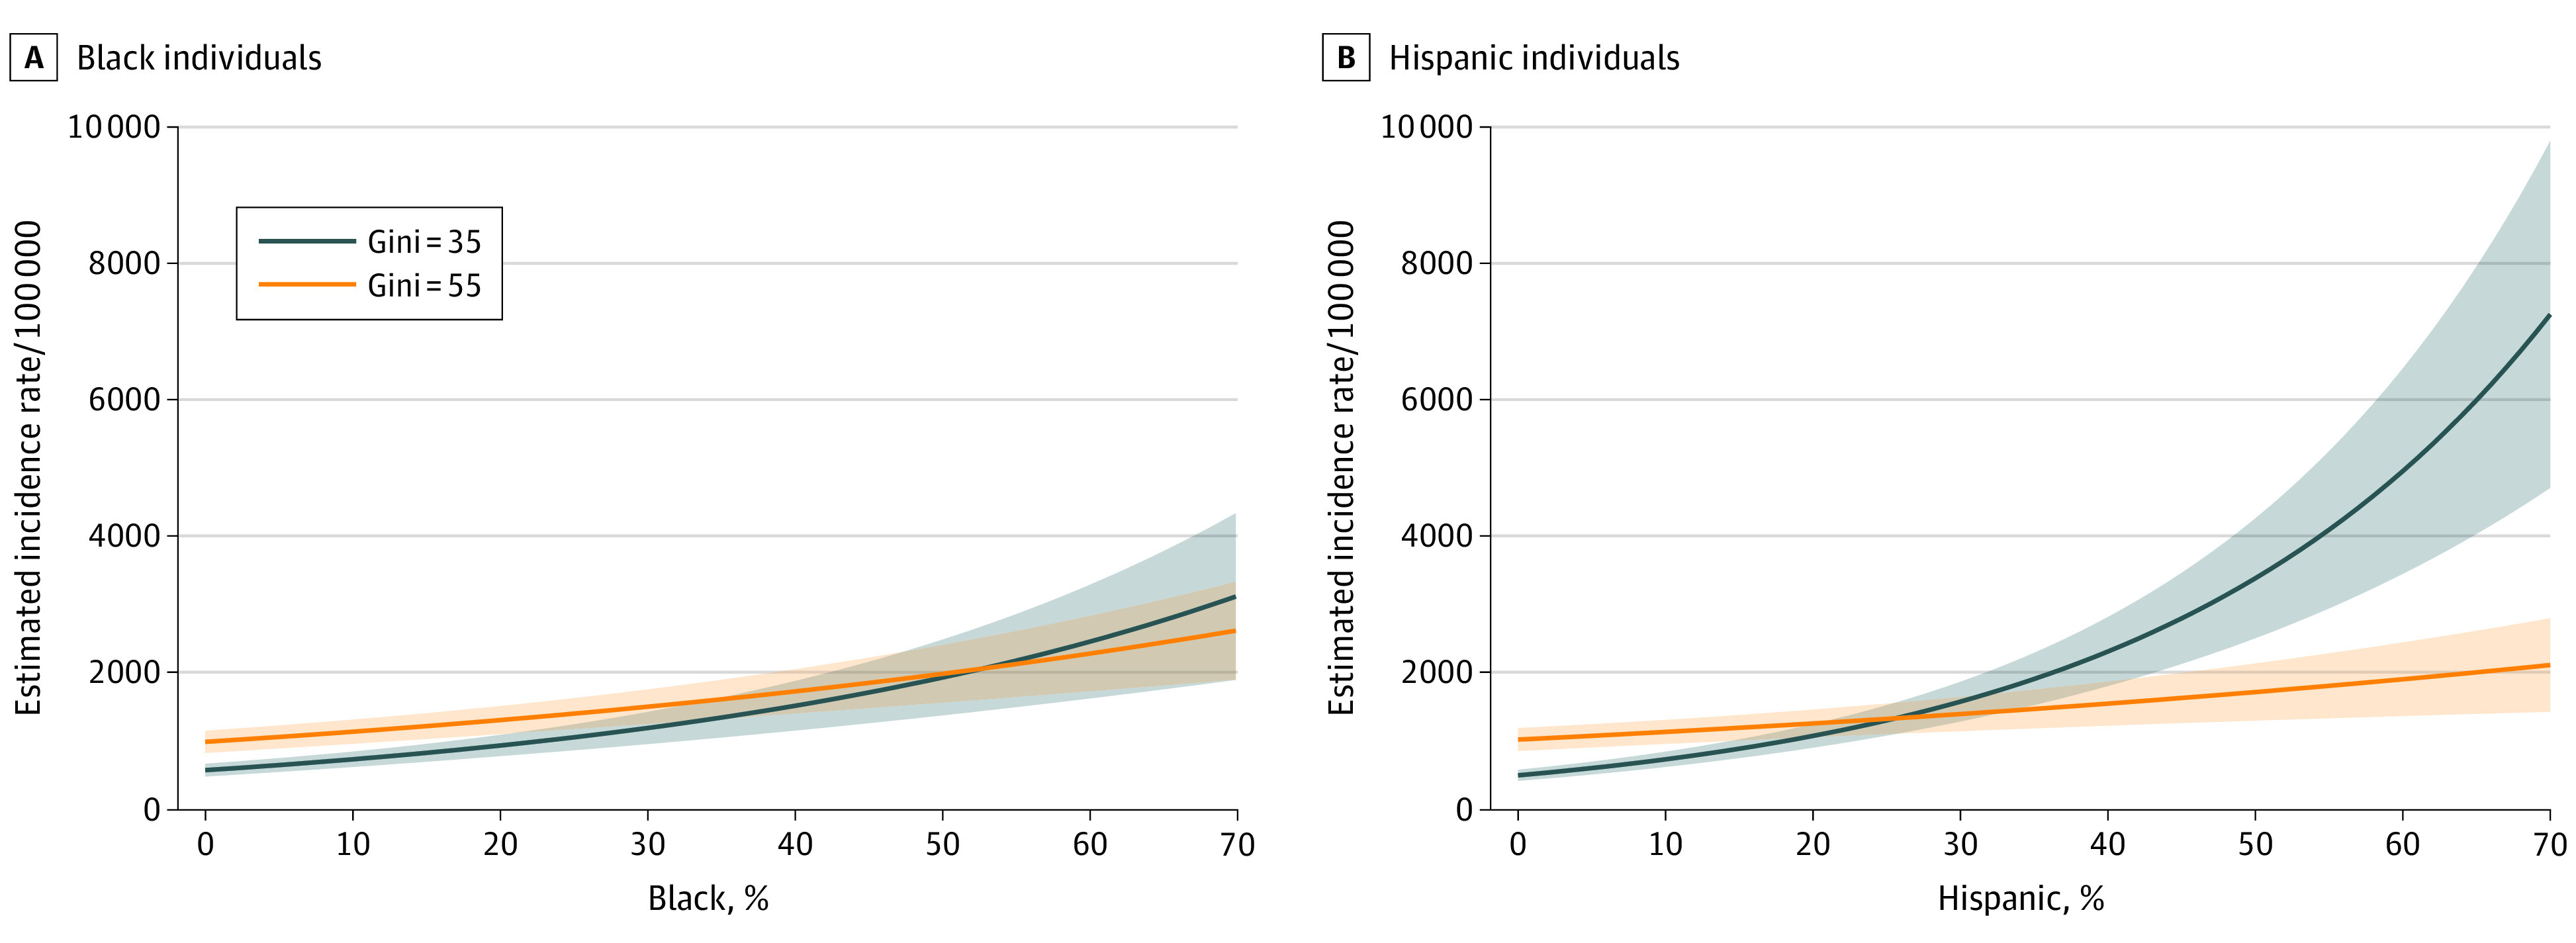
Figure 1. Incidence Estimations by County-Level Racial/Ethnic Composition and Gini Index for Income Inequality .

The Gini index ranges from 0, indicating perfect equality, to 100, indicating perfect inequality.

The Gini index ranges from 0, indicating perfect equality, to 100, indicating perfect inequality.