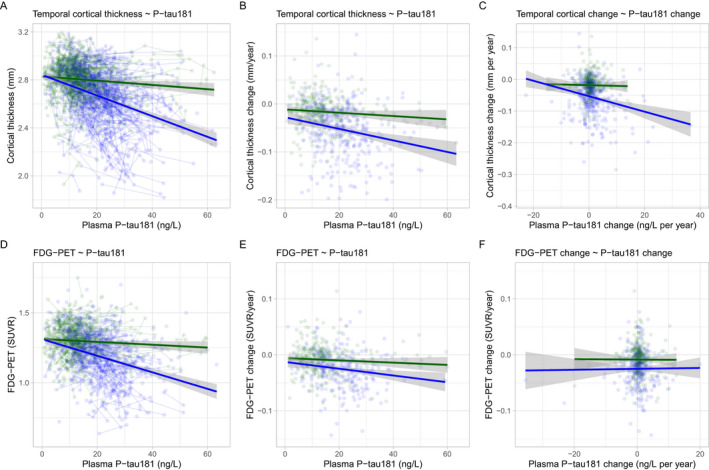
Figure 1.

Plasma P‐tau181 and imaging measures of neurodegeneration. Associations between temporal cortical thickness (panels A–C) and fluorodeoxyglucose PET (panels D–F) with plasma P‐tau181 levels, testing associations with all available paired data (panels A and D), associations between slopes of imaging measures and baseline P‐tau181 (panels B and E), and associations between slopes of imaging measures and slopes of P‐tau181 (panels C and F). All models are adjusted for age, sex, diagnostic group, APOE ε4 status, and Aβ status. Slope models are also adjusted for lag between the first imaging scan and first P‐tau181 measure. The effects in Aβ‐negative subjects are shown in green and effects in Aβ‐positive subjects are shown in blue (for individual subjects and average effect). Panels A and D show results from linear mixed‐effects models, with several data points per individual (individual subjects as a random factor). P‐values are extracted from the models for associations in Aβ‐negative and Aβ‐positive subjects separately. P‐values are also indicated for the difference in slopes between Aβ‐positive and Aβ‐negative subjects.
