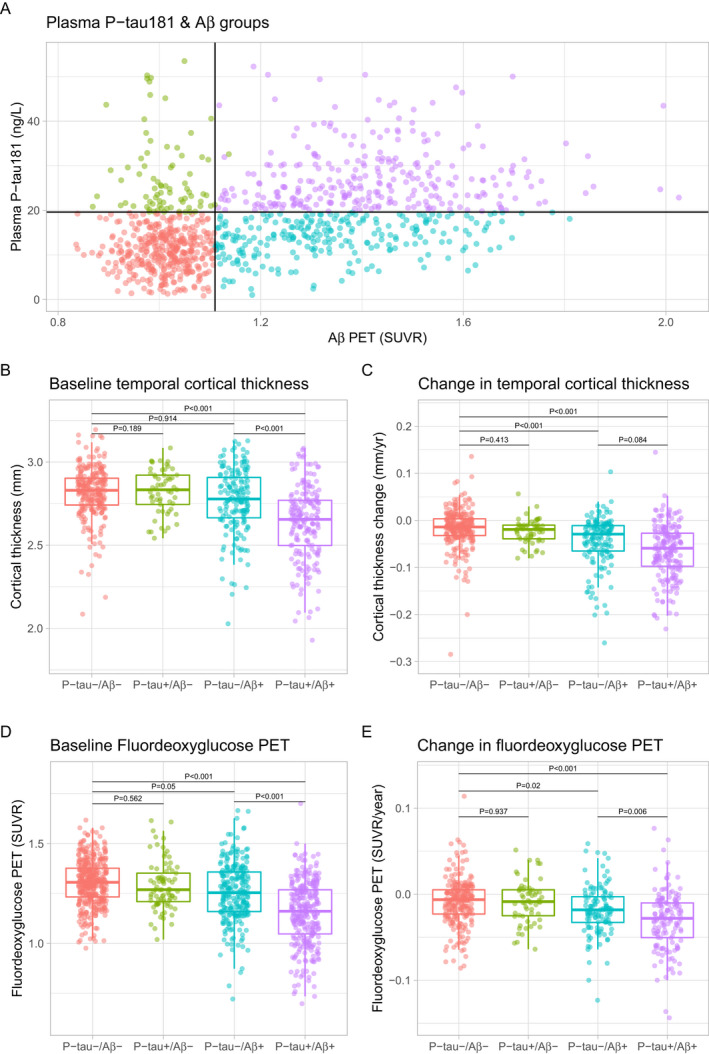
Figure 2.

Fluorodeoxyglucose PET and temporal cortical thickness by groups av P‐tau181 and Aβ‐PET positivity. Panel A shows the overall P‐tau181 and Aβ PET data, cut‐points for P‐tau181 (>19.8 ng/L) and Aβ PET (>1.11 SUVR) positivity, and the four groups created by combinations of P‐tau181 and Aβ PET. Panels B–E show differences between groups for temporal cortical thickness and FDG‐PET, at baseline and over time. The groups were compared in linear regression models, adjusted for age, sex, APOE ε4 status, diagnostic group, and lag between the first imaging scan and first P‐tau181 measure. P‐values are extracted for comparisons between P‐tau181−/Aβ‐ (reference) and all other groups, and between P‐tau181‐negative and ‐positive groups within the Aβ groups.
