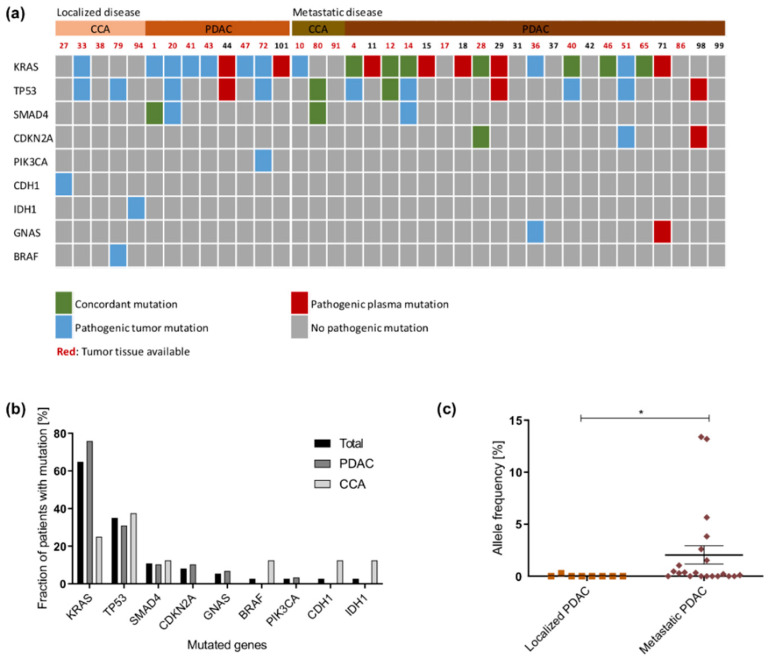
Figure 2.
NGS analysis in plasma samples: (a) Oncoprint showing mutation occurrence of nine most frequently mutated genes across all patients. Patients are divided into those with localized and those with metastatic tumors. Concordant mutations are displayed in green, while mutations only detected in tissue or plasma are displayed in blue or red, respectively. (b) Distribution of mutations across the plasma samples. (c) KRAS allele frequency in plasma samples. Samples from CCA patients were excluded, as no KRAS mutation was detected in the plasma samples from these patients. *: p < 0.05.

