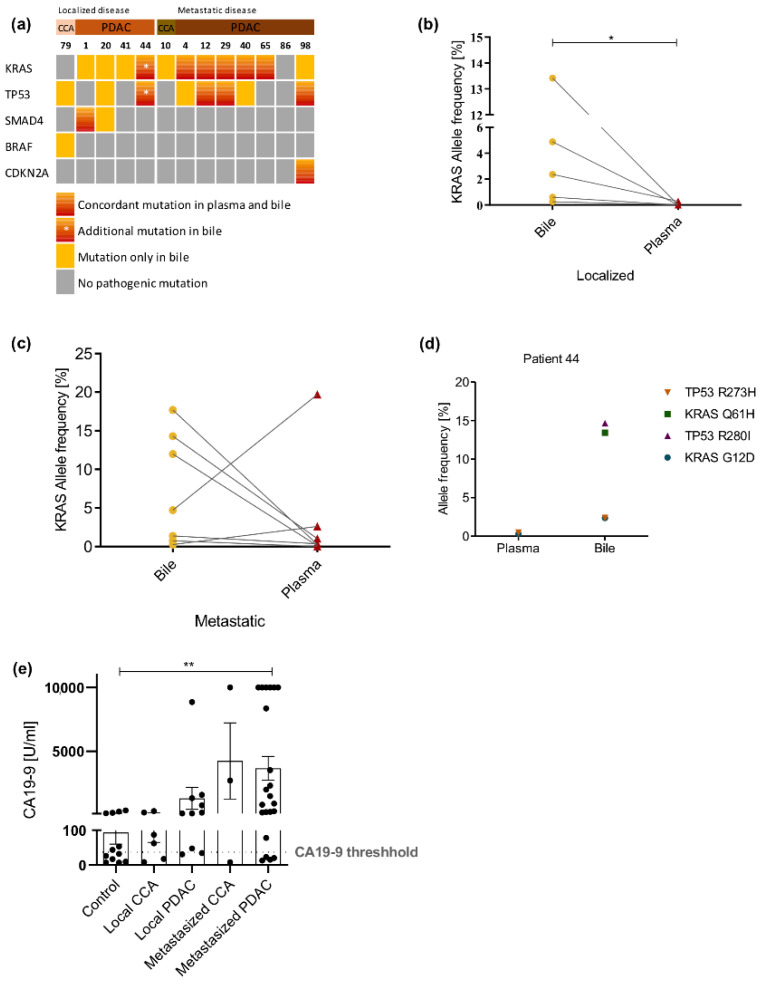
Figure 3.
Comparison of NGS results between bile and plasma. (a) Oncoprint showing comparison of mutation occurrence in five top genes across all patients in blood and bile cfDNA samples. Patients are divided into controls, patients with localized and patients with metastatic tumors. KRAS allele frequency in bile and plasma cfDNA in patients with localized (b) and metastatic disease (c). (d) KRAS and TP53 allele frequencies of patient 44 in plasma and bile. (e) CA19-9 serum levels of patients within our cohort. *: p < 0.05; **: p < 0.005.

