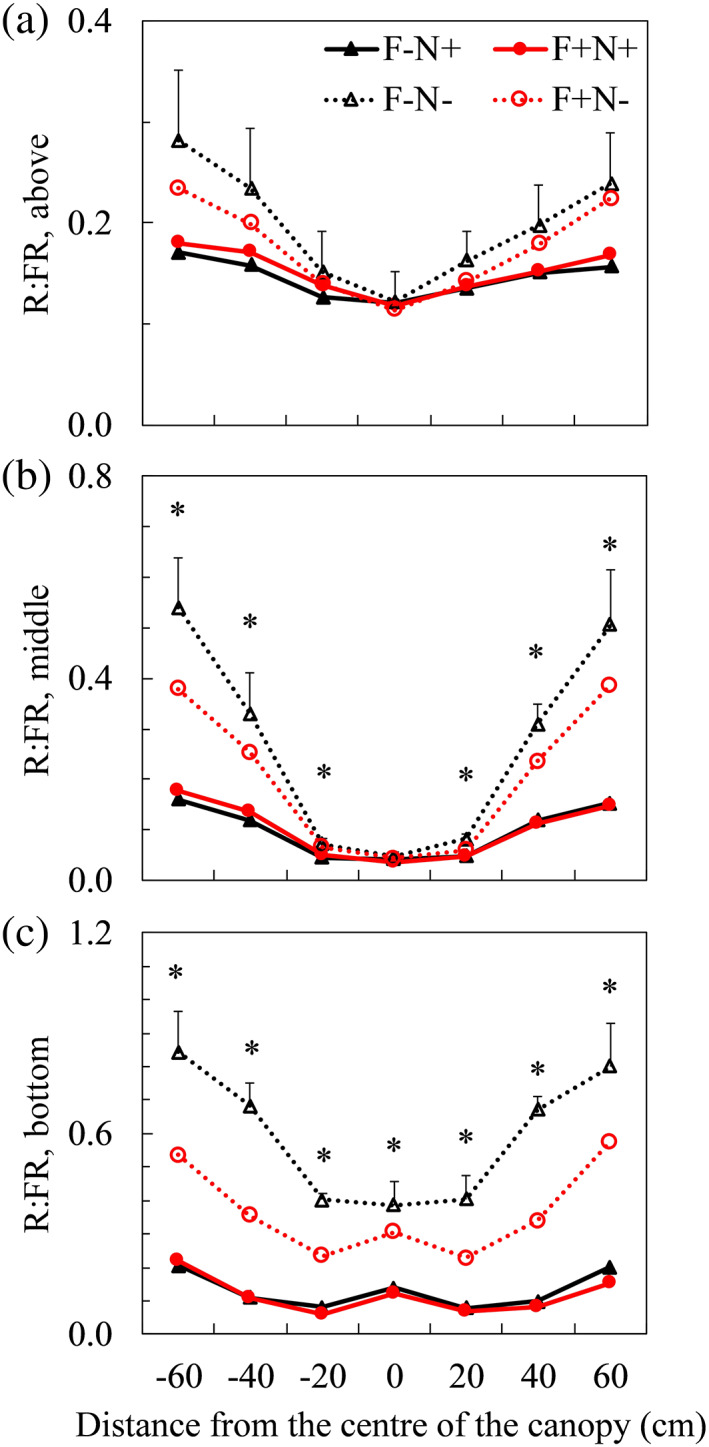
FIGURE 2.

Measured red to far‐red (R:FR) ratios above (a), in the middle (b) and at the bottom (c) of upright shoots at flowering stage (Day 21 after start of treatments) with spectrometer sensor facing down. In x‐axis, positive and negative values are horizontal distances from the centre of the canopy, respectively, to the right and to the left of the canopy. Details on measurement positions can be found in Figure 1. Positive error bars (only given in the highest line in each panel) are standard errors of means. * indicates significant treatment effects when comparing at the same measurement positions (p < .05). Pairwise comparisons results of R:FR in different treatments can be found in Table S2. Triangles indicate focal plants (F) without bent shoots (−). Circles indicate focal plants with bent shoots (+). Closed symbols with solid lines indicate neighbour plants (N) with bent shoots. Open symbols with dotted lines indicate neighbour plants without bent shoots [Colour figure can be viewed at wileyonlinelibrary.com]
