
Figure 3.
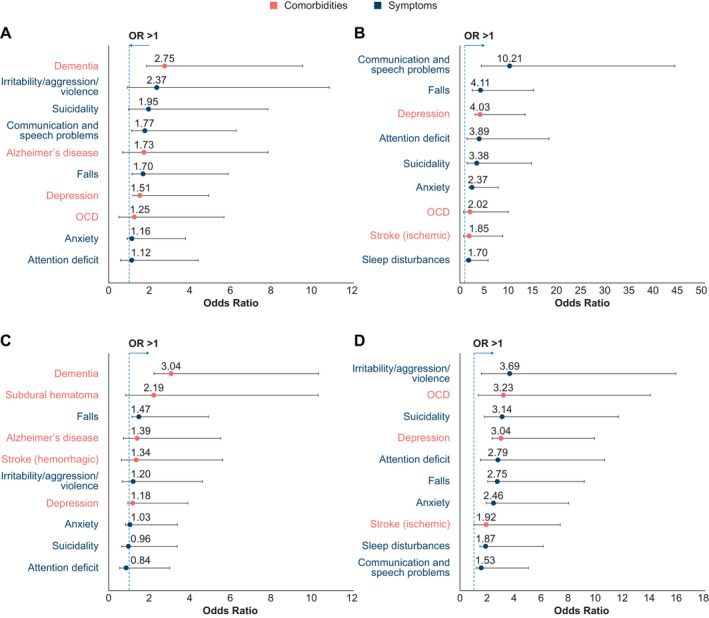
Prespecified comorbidities/symptoms in HD cases versus controls (odds ratios) (A) HD cases versus PD controls (analysis period only) (B) HD cases versus GP controls (analysis period only) (C) HD cases versus PD controls (analysis period and prior) (D) HD cases versus GP controls (analysis period and prior). N = 587 for each cohort. In each graph, the ten greatest odds ratios are presented, with 95% confidence intervals, from the panel of prespecified comorbidities that were reported in ≥ 5 cases and ≥ 5 controls. Odds ratios lower than those shown in the figure are presented in Table S11. Some prespecified comorbidities, while frequent among HD cases, were not sufficiently frequent in the respective control population to allow calculation of an odds ratio. These were, for Panel B: dementia, irritability/aggression/violence, and Alzheimer’s disease, and for Panel D: dementia. GP: general population; HD: Huntington’s disease; OCD: obsessive–compulsive disorder; PD: Parkinson’s disease.