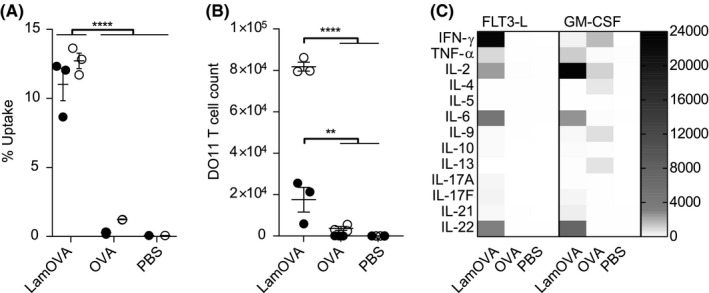
Figure 3.

(A) Uptake of pHrodo‐labeled OVA or LamOVA conjugates by GM‐BMDCs (white circles) and FL‐BMDCs (black dots) was analyzed by flow cytometry after 24 hours. (B) Proliferation of OVA‐specific DO11.10 T cells after 5 days co‐culture with BMDCs and OVA or LamOVA. Data are shown as number of live, proliferating DO11.10 cells. (C) Cytokine concentration in BMDC‐T cell co‐culture supernatants in pg/mL. Means ± SEM and individual technical replicates (n = 3) are shown. Data were statistically analyzed by two‐way ANOVA followed by Tukey's post hoc test
