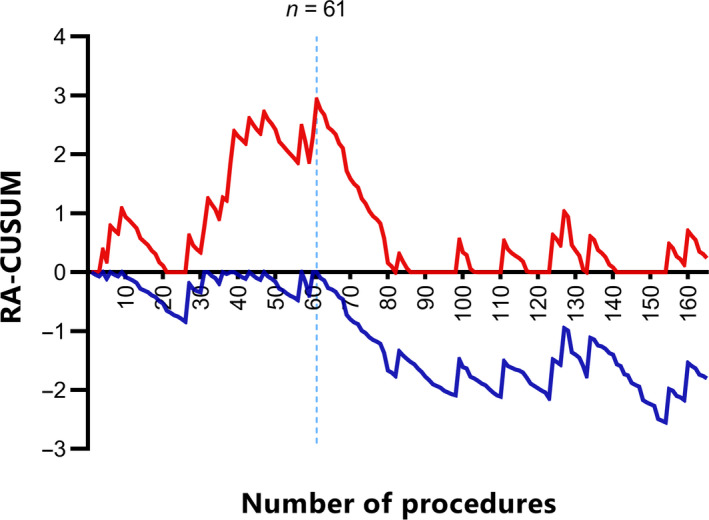
Figure 1.

The learning curve of robot‐assisted laparoscopy for recurrent cervical cancer. The x‐axis indicates the number of procedures performed. The y‐axis indicates the cumulative sum of success and failure of the surgical team in terms of recurrence, adjusted for the probabilities from the risk model. The RA‐CUSUM+ (red) is designed to detect decrease in surgical performance while RA‐CUSUM− (blue) is designed to detect increase in the surgical performance. Both curves move upward for surgical failure and downward for surgical success.
