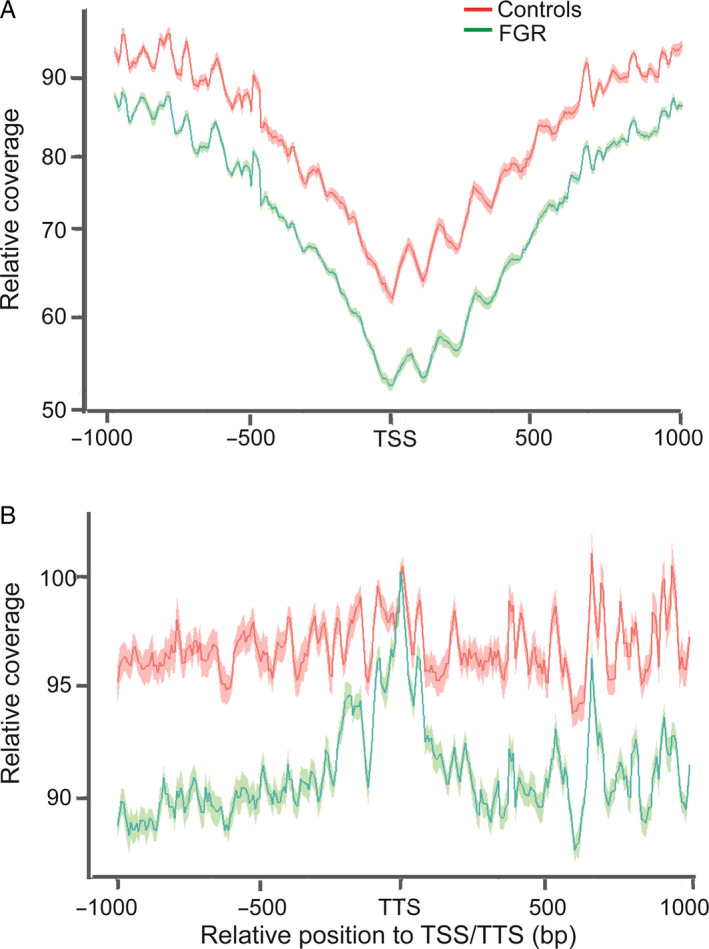
Figure 2.

Differences in local nucleosome profiles between fetal growth restriction (FGR) and controls. Cell‐free DNA (cfDNA) signals in transcription start sites (TSS) and transcription termination sites (TTS) regions decreased in FGR cases. The red line represents mean average cfDNA signals of controls and the red shadow represents its standard error of mean. The green line represents mean average cfDNA signals of FGR cases and the green shadow represents its standard error of mean. (A) Average cfDNA signals at TSS regions. (B) Average cfDNA signals at TTS regions.
