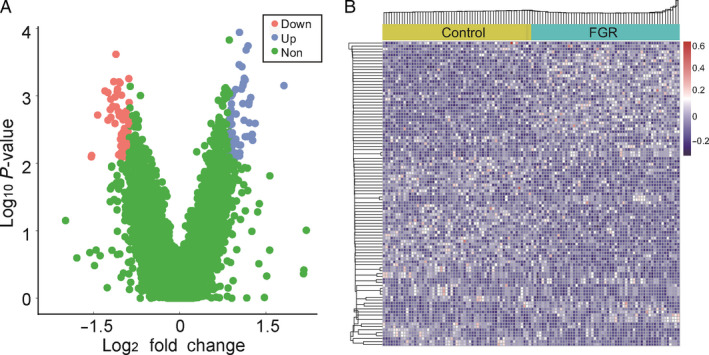
Figure 3.

Gene transcripts with differential read coverage at transcription start sites (TSS). (A) Volcano plots of gene transcripts with differential read coverage at the TSS, as detected by whole‐genome sequencing (|Log2 fold change| ≥1.5 and FDR <0.1). Blue blots represent genes with up‐regulated promoter read depth coverage, red blots represent genes with down‐regulated promoter read depth coverage, and green blots represent genes with no significant difference. (B) Heat map of the z‐scores of promoters with differential read coverage.
