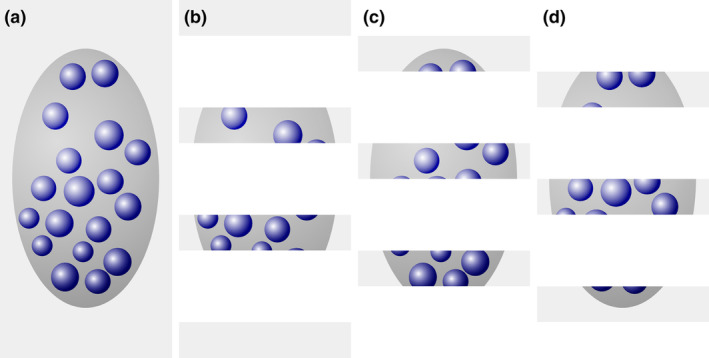
FIGURE 3.

Dependence of profile counts on object size. (a) A region (dark gray) containing 18 cells (blue objects) is cut into three series of sections (b–d). In each series, the profiles of cells visible in the sections are counted. In series (b), (c), and (d), 10, 13, and 11 profiles are counted. The average of the 3 possible estimates, 30, 39, and 33, is 34. The increase in the size of the cells relative to those in Figure 2 results in an estimate of 34 instead of 27 cells. The true cell number is 18 [Color figure can be viewed at wileyonlinelibrary.com]
