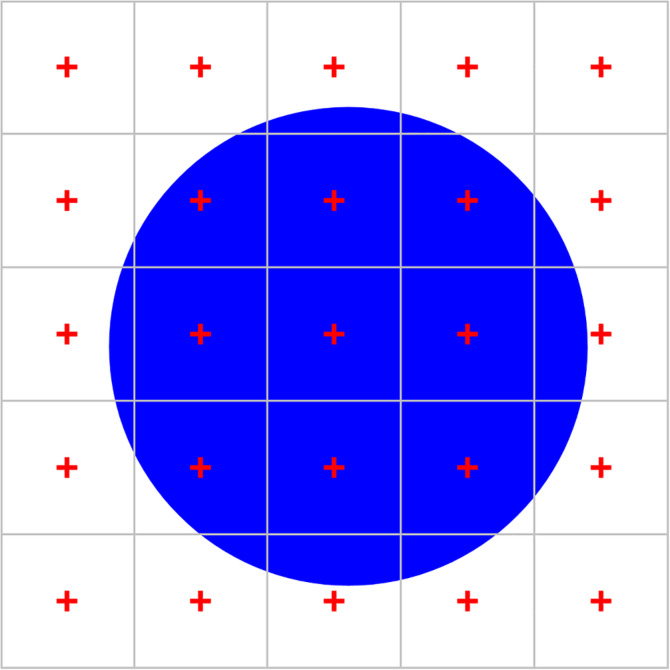
FIGURE 11.

Using a point grid to estimate area. When the reference area is probed with a grid containing 25 points, 9 points fall onto the blue circle. We estimate the area of the blue circle to 9/25th of the reference area. Alternatively, we can look at this sample as 25 smaller areas, each with 1/25th of the full area, that are each probed with one point. The area estimate of the blue circle would correspond to nine times the smaller area, that is, we do not need to know the reference area but only the area associated with each point [Color figure can be viewed at wileyonlinelibrary.com]
