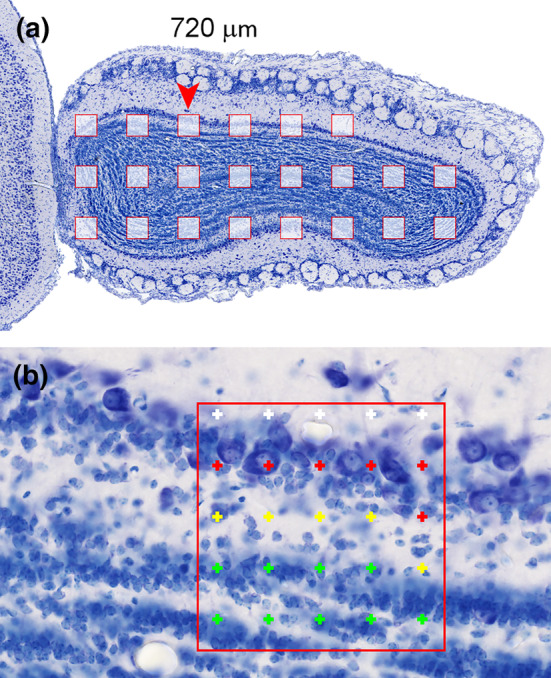
FIGURE 16.

Area fraction fractionator. (a) Areas that are sampled in this section. The sampling sites are 350 μm apart along the x‐ and y‐axes. The arrowhead marks the sampling site illustrated in (b). At each sampling site, a small area (150 × 150 μm) is probed with a grid of points that are 30 μm apart along the x‐ and y‐axes. At this sampling site, six points are counted in the mitral cell layer (red), five points in the inner plexiform layer (yellow), and nine points in the granule cells layer. Five points (white) fall outside the region of interest [Color figure can be viewed at wileyonlinelibrary.com]
