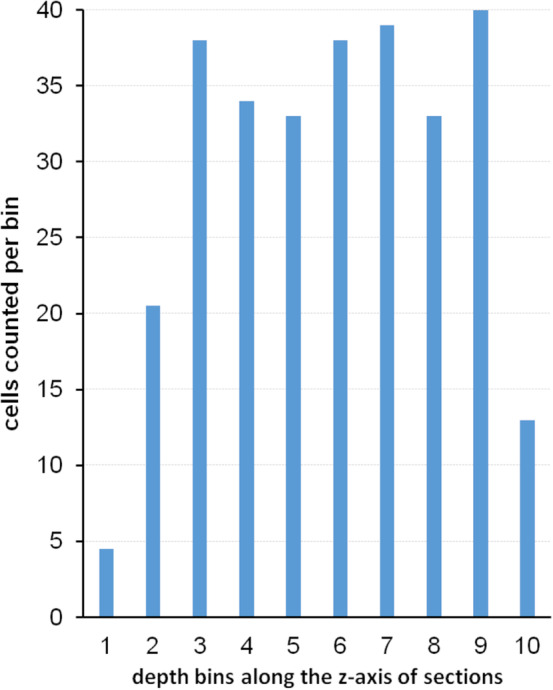
FIGURE 21.

Z‐axis plot of cells. Hippocampal CA3 pyramidal cells are observed throughout the depth of methacrylate sections. The depth of their first recognition is recorded. Cells already visible in the top focal plane of the section are omitted. If cells distribute evenly throughout the thickness of the sections, similar numbers should appear in each bin. In this example, cells distribute evenly from Bin 3 to Bin 9. Low numbers in Bins 1 and 2 were due to low counts in the top 2 μm of the sections. Low numbers in Bin 10 were due to low cell numbers in the bottommost 1 μm of the sections [Color figure can be viewed at wileyonlinelibrary.com]
