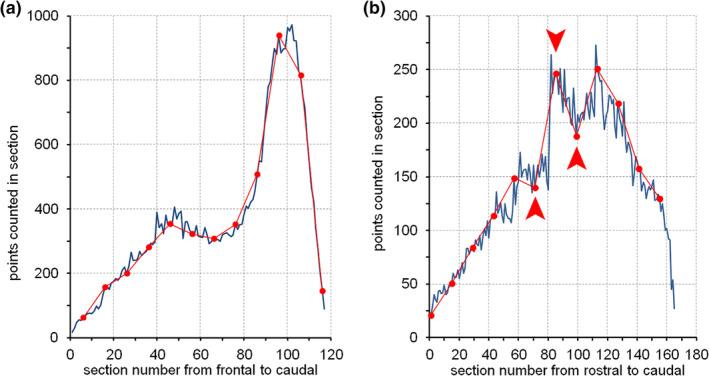
FIGURE 39.

The smoothness of volume distributions. The graphs show samples of 12 sections (red dots) of the (a) entire mouse dentate gyrus and (b) rat hippocampal CA1 pyramidal cell layer in coronal series of sections. Dark lines show the volume distribution based on all sections. Sample values in (a) appear reasonably predictable by the surrounding values and m = 1 seems suitable for this sample, which also has been verified empirically (Basler et al., 2017). Sample values in (b) do show sudden jumps (arrows) that do not appear to be predicted by the preceding or following sample values. The appearance of the data plot and empirical results (Slomianka & West, 2005) suggest that m = 0 would be the most suitable choice [Color figure can be viewed at wileyonlinelibrary.com]
