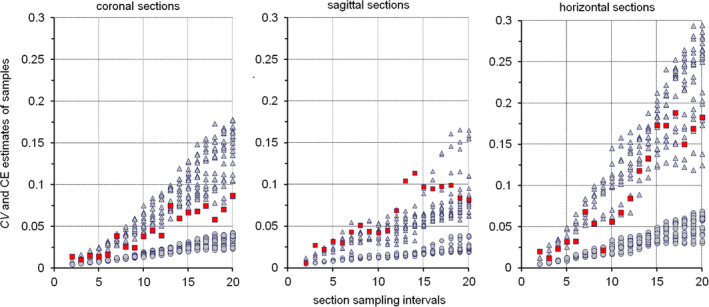
FIGURE 41.

Sectioning and estimate precision. Graphs show the empirically derived CVs (red) and Gundersen–Jensen CE estimates (triangles for m = 0 and circles for m = 1) for the mouse dentate gyrus granule cell layer (data from Basler et al., 2017). CV estimates are based on exhaustive series of 20 μm thick methacrylate sections. The graphs represent the CVs and CEs for coronal, sagittal, and horizontal series of sections. With larger intervals between sampled section, CEs increase slower when the coronal and sagittal series are sampled than when the horizontal series is sampled. With the exception of sampling intervals between 12 and 15 (see Section 8.10), empirical CVs are estimated reasonably well by CE estimates using an m of 0 [Color figure can be viewed at wileyonlinelibrary.com]
