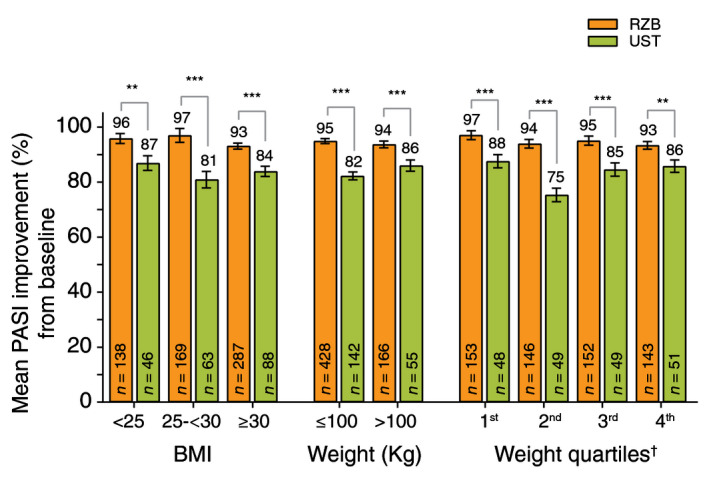
Figure 3.

Mean PASI improvement (%) from baseline to week 52 for patients treated with risankizumab and/or ustekinumab by BMI and body weight quartiles (LOCF)†. BMI, body mass index; LOCF, last observation carried forward; PASI, Psoriasis Area and Severity Index; RZB, risankizumab; UST, ustekinumab. **P < 0.01, ***P < 0.001 compared with ustekinumab. Data expressed as mean per cent PASI improvement ± standard error (SE). †Weight quartiles (minimum – maximum) were defined in kg as follows: 1st (43.5–74.0), 2nd (74.2–86.8), 3rd (87.0–103.0) and 4th (103.2–170.0).
