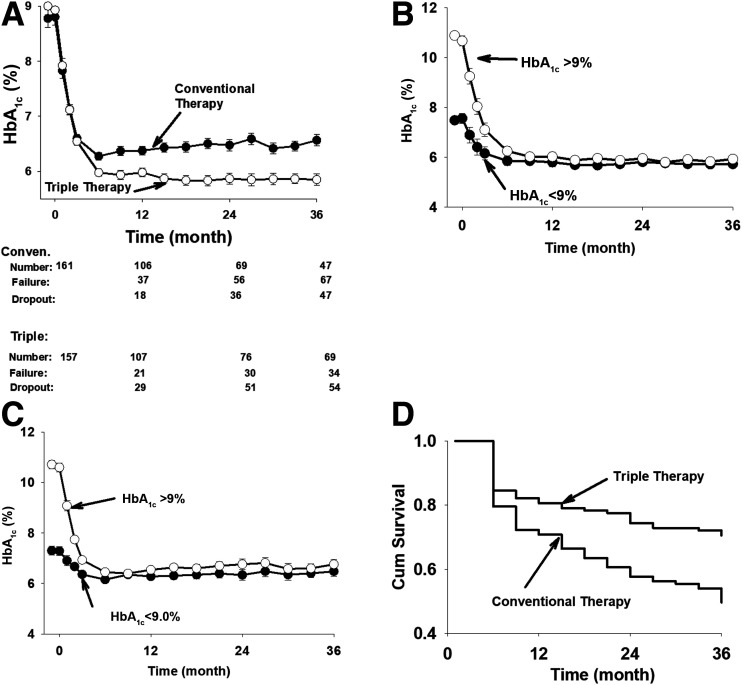
Figure 1.
Time-related change in HbA1c in the ITT analysis. Conven., conventional (A). Decrease in HbA1c in patients receiving triple therapy who had baseline HbA1c values ≥9.0% and <9.0% (B). Decrease in HbA1c in patients in the conventional therapy group who had baseline HbA1c values ≥9.0% and <9.0% (C). Kaplan-Meier plot of time to treatment failure in the triple therapy and conventional therapy groups. Cum, cumulative (D). Patients who dropped out of the study were not included.

