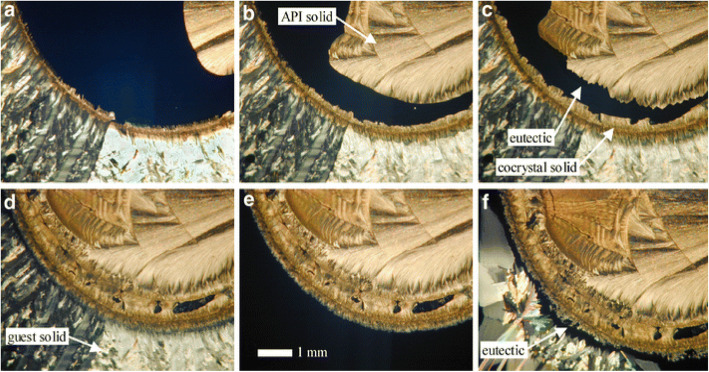
Fig. 5.
HSM micrographs of cocrystal screening of API with glutaric acid, the upper half of the micrograph shows the API whereas the lower half is glutaric acid. a, b, c- curved line and dark area at interface depicts cocrystal phase and eutectic phase respectively, d- narrow eutectic area as eutectic melting approaches, e- melting of glutaric acid, f- recrystallization of glutaric acid alongwith eutectic and cocrystal phase. Reprinted from McNamara et al. 2006 with permission from the publisher

