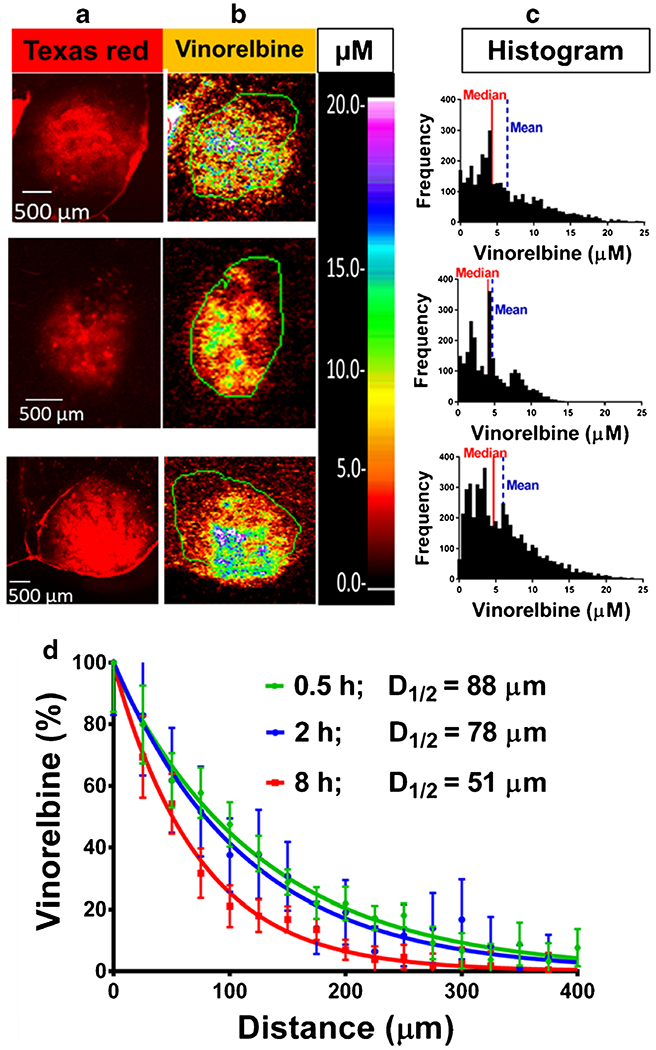
Fig. 5.

Heterogeneous vinorelbine distribution within brain metastases and concentration in brain adjacent to tumor (BAT). Three representative high (≥ 10 × brain) 3H-vinorelbine-uptake MDA-MB-231BR metastases showing heterogeneous internal vinorelbine distribution. Images across a row are of the same metastasis. a Texas red fluorescence for permeability analysis, scale bar = 500 μm. b QAR images with concentration scale set to the same maximum, as indicated by μM scale bar. c Frequency distributions of 3H-vinorelbine concentration with medians (red line) and means (blue dashed line). d Analysis of vinorelbine concentration from tumor edge to brain, expressed as % of average concentration at tumor edge (0 mm) in n = 13–15 regions of leaky tumors for each time point. Each time point is normalized to the calculated plateau of the curve.
