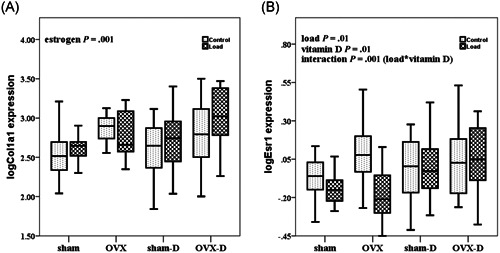
Figure 3.

Box whisker plots of relative log transformebone gene expression of Col1a1 and Esr1 during estrogen deficiency (OVX) and/or vitamin D deficiency and after mechanical loading. The box represents median, 25th and 75th percentiles, and the whiskers represent highest and lowest gene expression values. Each group comprises 10 rats. Open boxes are non‐loaded and filled boxes are loaded ulnae, sham is sham surgery, D is vitamin D deficient. P values are calculated as follows: load, non‐loaded versus loaded; vitamin D, vitamin D sufficient versus deficient; estrogen, estrogen sufficient versus deficient; load*vitamin D, interaction between mechanical loading and vitamin D. OVX, ovariectomy
