FIGURE 1.

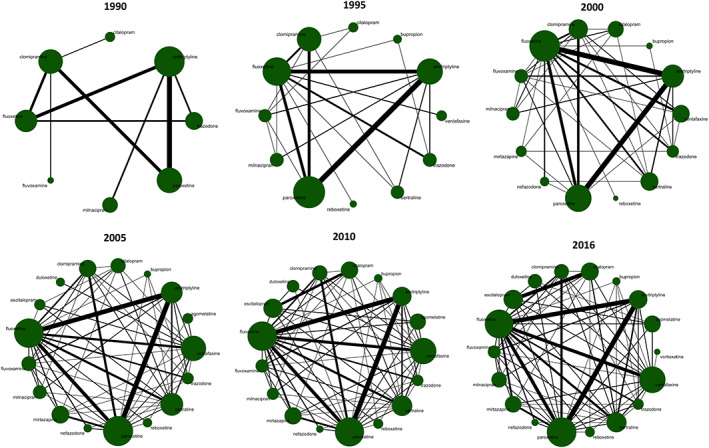
Network diagrams for efficacy over the years. The width of the lines is proportionate to the number of studies including that comparison. The size of nodes is proportionate to the number of randomized patients for that arm

Network diagrams for efficacy over the years. The width of the lines is proportionate to the number of studies including that comparison. The size of nodes is proportionate to the number of randomized patients for that arm