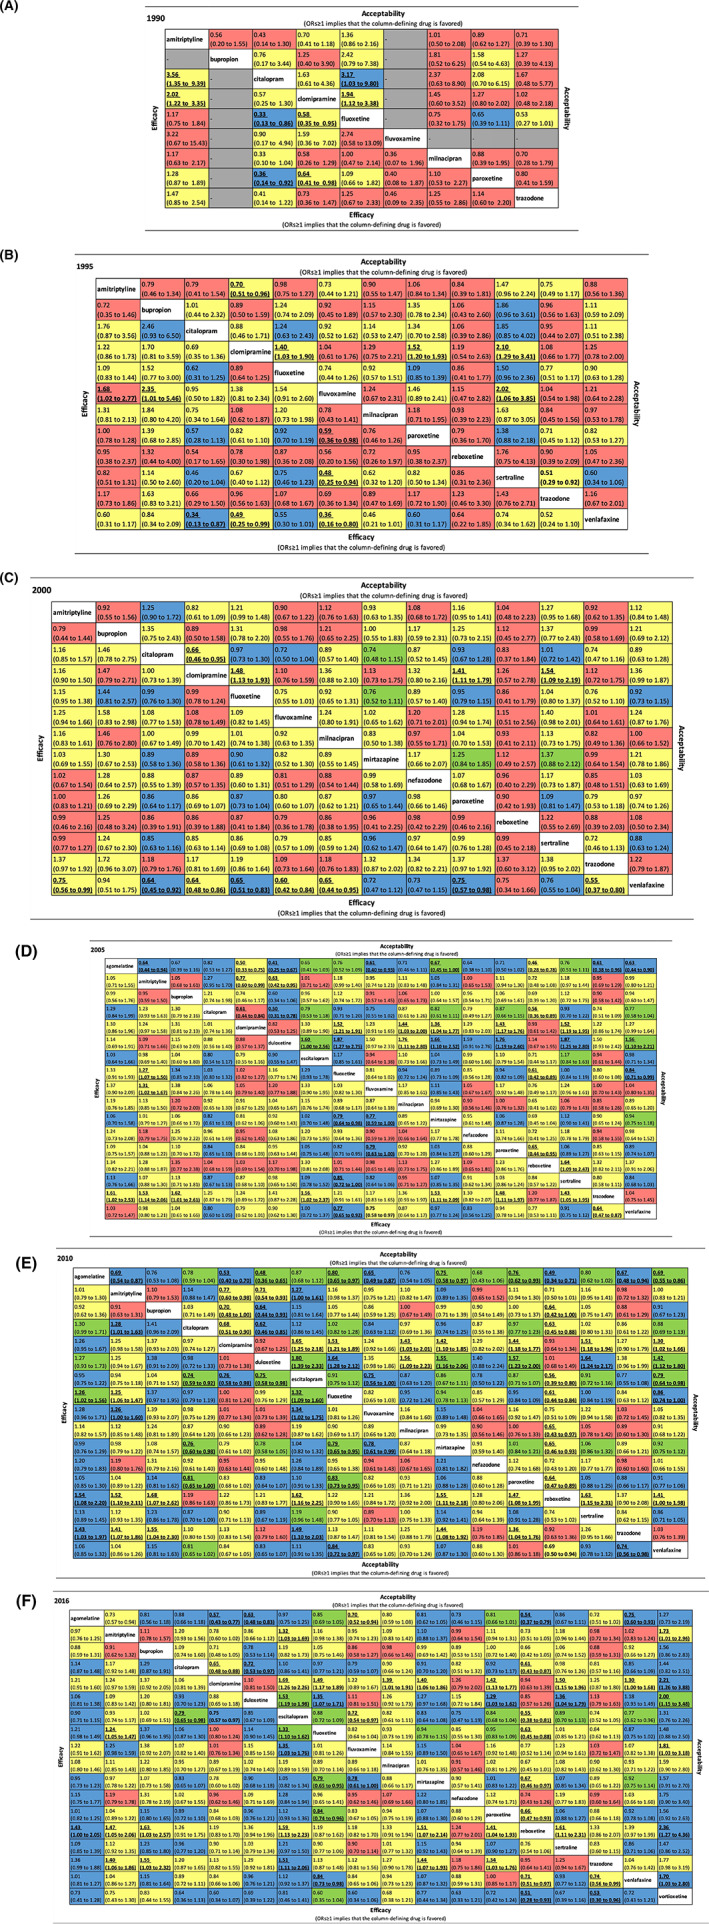
FIGURE 2.

Efficacy, acceptability and confidence in the evidence for each comparison over the years. The lower triangle of the table illustrates the efficacy and the upper triangle indicates acceptability. The value in each cell indicate the OR and its 95% CIs for each comparison. It is defined as the treatment listed in the column compared with the drug listed in the row. As a result, for both efficacy and acceptability, ORs≥1 implies that the column‐defining drug is favored. Statistically significant results were presented in bold and underlined. The confidence of evidence based on CINeMA for each comparison is shown in different colors in each cell. Green: high confidence; blue: moderate confidence; yellow: low confidence; red: very low confidence
