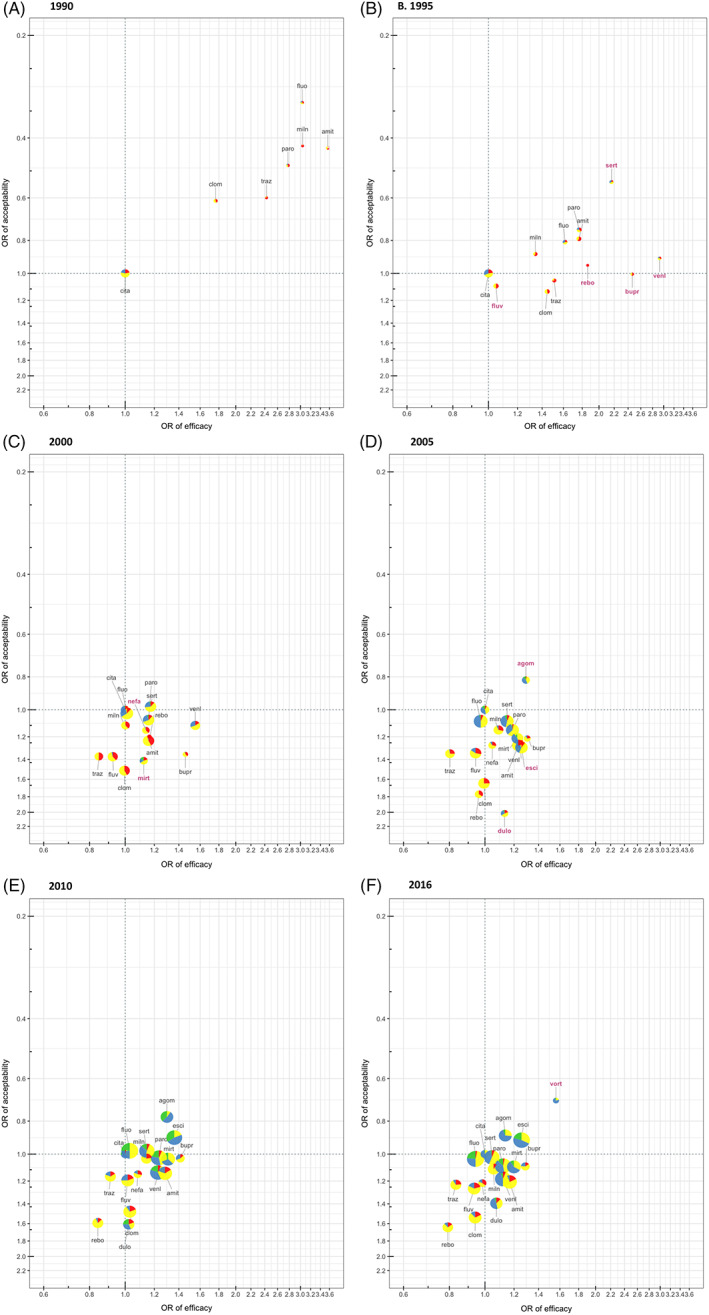
FIGURE 3.

Two‐dimensional plots about efficacy, acceptability and confidence in the evidence from 1990 until 2016. Results are presented as ORs compared with citalopram. Efficacy is shown in x‐axis, with ORs≥1 favoring the specific drug, while acceptability is shown in y‐axis, with ORs≥1 favoring citalopram. Therefore, the drugs in the right upper corner should be better in both efficacy and acceptability. The node for each drug is shown in terms of pie chart, which indicates the composition of 4‐level confidence of evidence of all the comparisons including that drug, of both efficacy and acceptability. Green: high confidence; blue: moderate confidence; yellow: low confidence; red: very low confidence. The drugs in the up‐right direction of green dotted lines indicate generally recommendable drugs, while drugs in the down‐left direction of red dotted lines indicate the less recommendable drugs at that time point, based on efficacy, acceptability and certainty of evidence. The size of each node is proportionate to the inverse of the width of confidence interval regarding efficacy. The label of a drug name in pink and bold indicates that drug first appears in that network (a relatively new drug). A~F shows the evidences at 6 time points: 1990, 1995, 2000, 2005, 2010, and 2016
