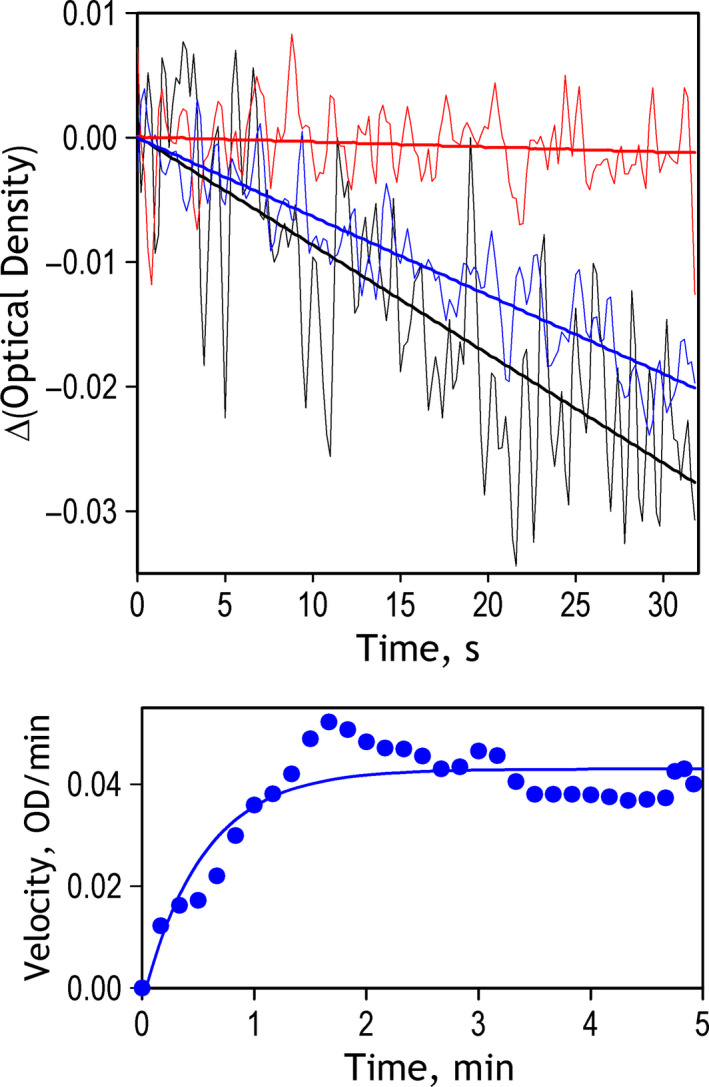
Fig. 4.

Reversibility of pressure‐induced changes in the rate of catalysis in LDH from N. kermadecensis. Top panel shows the kinetic traces of the decrease in optical density at 350 nm recorded at 1 bar before the experiment (black), at 2.25 kbar (red) and in 200 s after decompression (blue). Bold straight lines show the linear approximations of the recorded traces. Bottom panel shows the time dependence of the reaction rate after decompression. The data were obtained by numerical differentiation of the kinetic curve of the decrease in optical density recorded after decompression. The solid line shows the results of fitting of the dataset to the exponential equation. Characteristic time of the recovery derived from this approximation is equal to 0.54 min.
