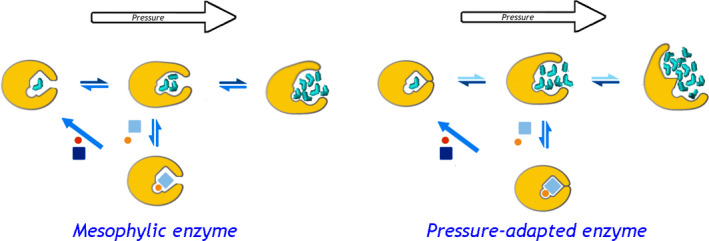
Fig. 6.

A schematic representation of the proposed mode of piezophilic adaptation in LDH through increasing volume changes in its conformational transitions. The top row shows the enzyme monomer (yellow) in three different conformations: closed (‘ground state’, left), open substrate‐free (‘excited state’, middle) and deactivated (‘pressure‐promoted’, top right). The Michaelis complex (bottom) formed through binding the substrate (pyruvate, orange circle) and the cofactor (NADH, light‐blue rectangle) proceeds through the catalytic step (diagonal arrow) followed by release of the product (lactate) and the oxidized cofactor (red circle and dark‐blue rectangle). Bidirectional arrows indicate reversible conformational transitions, where the color depth symbolizes the position of equilibrium at atmospheric pressure. Water molecules filling the enzyme cavities are shown in cyan. The left diagram shows the position of equilibria and degree of protein hydration in the mesophilic enzyme, while situation observed in the pressure‐adapted enzyme is illustrated on the left.
