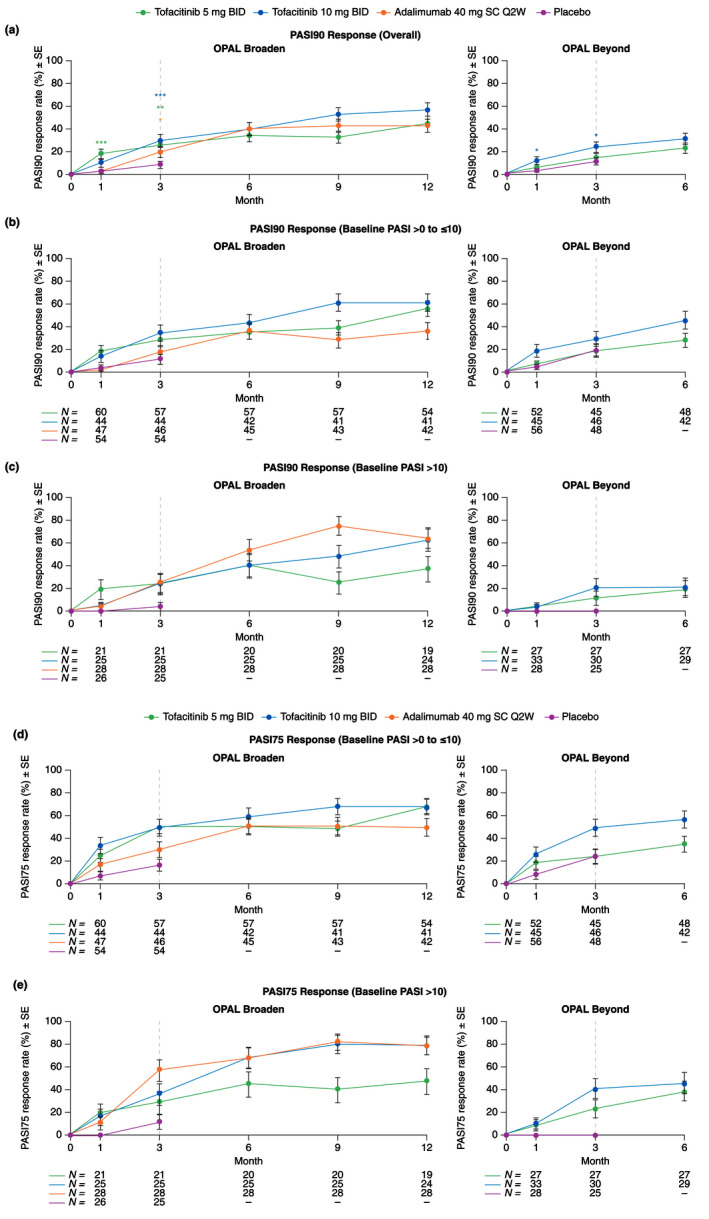
Figure 1.

PASI90 and PASI75 response rates by baseline PASI severity (Assessed in patients with baseline BSA ≥3% and PASI >0; Post hoc analysis) (SE): (a) PASI90 (overall); (b) PASI90 (baseline PASI >0 to ≤10) (Baseline PASI >0 to ≤10, mild disease severity); (c) PASI90 (baseline PASI >10) (Baseline PASI >10, moderate–severe disease severity); (d) PASI75 (baseline PASI >0 to ≤10) (Baseline PASI >10, moderate–severe disease severity); (e) PASI75 (baseline PASI > 10) (Baseline PASI >10, moderate–severe disease severity). *Nominal P ≤ 0.05; **P < 0.01; ***P < 0.001 vs. placebo. Dashed lines indicate the end of the placebo‐controlled period (Month 3). For (a), treatment comparisons with placebo at Months 1 and 3 were based on normal approximation of the difference in binomial proportions. Missing responses were imputed as nonresponse at all time points. Patients included in the analysis had baseline BSA ≥3% and PASI >0 and patient numbers were the same across visits. In OPAL Broaden, the numbers of unique patients were 82, 70, 77 and 82 for tofacitinib 5 mg BID, tofacitinib 10 mg BID, adalimumab 40 mg SC Q2W and placebo, respectively. In OPAL Beyond, the numbers of unique patients were 80, 81 and 86 for tofacitinib 5 mg BID, tofacitinib 10 mg BID and placebo, respectively. For (b) – (e), no imputation was performed as these were descriptive only. N is the number of patients evaluable at each visit in each subgroup. BID, twice daily; BSA, body surface area; PASI, Psoriasis Area and Severity Index; PASI75, ≥75% improvement from baseline in PASI; PASI90, ≥90% improvement from baseline in PASI; Q2W, once every 2 weeks; SC, subcutaneous; SE, standard error.
