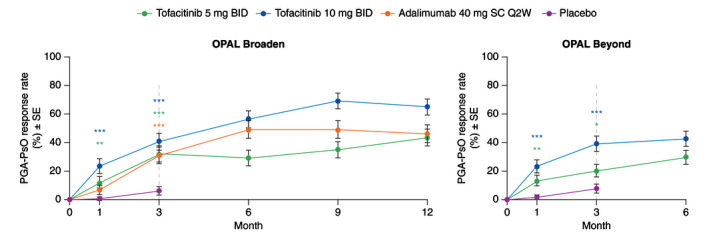
Figure 2.

PGA‐PsO response rates (PGA‐PsO response is defined as a score of 0 (clear)/1 (almost clear) on a 0–4 scale and ≥2‐point improvement from baseline in patients with baseline PGA‐PsO ≥2; Post hoc analysis) (SE) among patients with baseline PGA‐PsO ≥2. *Nominal P ≤ 0.05; **P < 0.01; ***P < 0.001 vs. placebo. Dashed lines indicate the end of the placebo‐controlled period (Month 3). Treatment comparisons with placebo at Months 1 and 3 were based on normal approximation of the difference in binomial proportions. Missing responses were imputed as nonresponse. The numbers of patients included in the analysis were the same across visits. In OPAL Broaden, the numbers of unique patients were 71, 71, 67 and 74 for tofacitinib 5 mg BID, tofacitinib 10 mg BID, adalimumab 40 mg SC Q2W and placebo, respectively. In OPAL Beyond, the numbers of unique patients were 87, 89 and 85 for tofacitinib 5 mg BID, tofacitinib 10 mg BID and placebo, respectively. BID, twice daily; PGA‐PsO, Physician’s Global Assessment of Psoriasis; Q2W, once every 2 weeks; SC, subcutaneous; SE, standard error.
