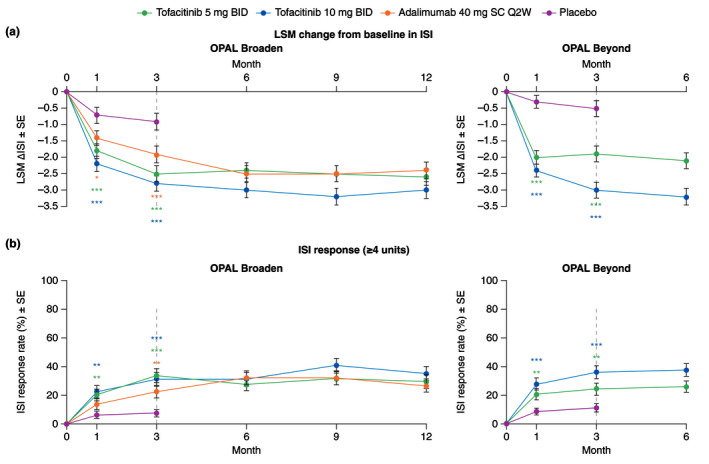
Figure 5.

ISI in patients with baseline ISI >0, (a) LSM (SE) change from baseline (Prespecified analysis); (b) ISI response rate (≥4 units) (Post hoc analysis; Responders were patients with a ≥4 unit improvement from baseline. ISI score range 0–10, where 0 = no itching and 10 = worst possible itching). *Nominal P ≤ 0.05; **P < 0.01; ***P < 0.001 vs. placebo. Dashed lines indicate the end of the placebo‐controlled period (Month 3). For (a), in the analyses of change from baseline in ISI through the first 3 months, the two placebo‐to‐tofacitinib sequences were combined into a single placebo group (pooled placebo group); the results through Month 3 are from a repeated measures model. For results after Month 3, the two placebo‐to‐tofacitinib sequences were separate in another repeated measures model (data not shown). No imputation was applied for missing values. In OPAL Broaden, the numbers of unique patients included in the repeated measures model were 96, 93, 93 and 91 for tofacitinib 5 mg BID, tofacitinib 10 mg BID, adalimumab 40 mg SC Q2W and placebo, respectively. In OPAL Beyond, the numbers of unique patients included in the repeated measures models were 109, 120 and 114 for tofacitinib 5 mg BID, tofacitinib 10 mg BID and placebo, respectively. For (b), in the ISI responder analysis, treatment comparisons with placebo at Months 1 and 3 were based on normal approximation of the difference in binomial proportions. Missing response was imputed as nonresponse. The numbers of patients included in the analysis were the same across visits. In OPAL Broaden, the numbers of unique patients were 97, 93, 93 and 92 for tofacitinib 5 mg BID, tofacitinib 10 mg BID, adalimumab 40 mg SC Q2W and placebo, respectively. In OPAL Beyond, the numbers of unique patients were 111, 122 and 115 for tofacitinib 5 mg BID, tofacitinib 10 mg BID and placebo, respectively. ∆, change from baseline; BID, twice daily; ISI, Itch Severity Item; LSM, least squares mean; Q2W, once every 2 weeks; SC, subcutaneous; SE, standard error.
