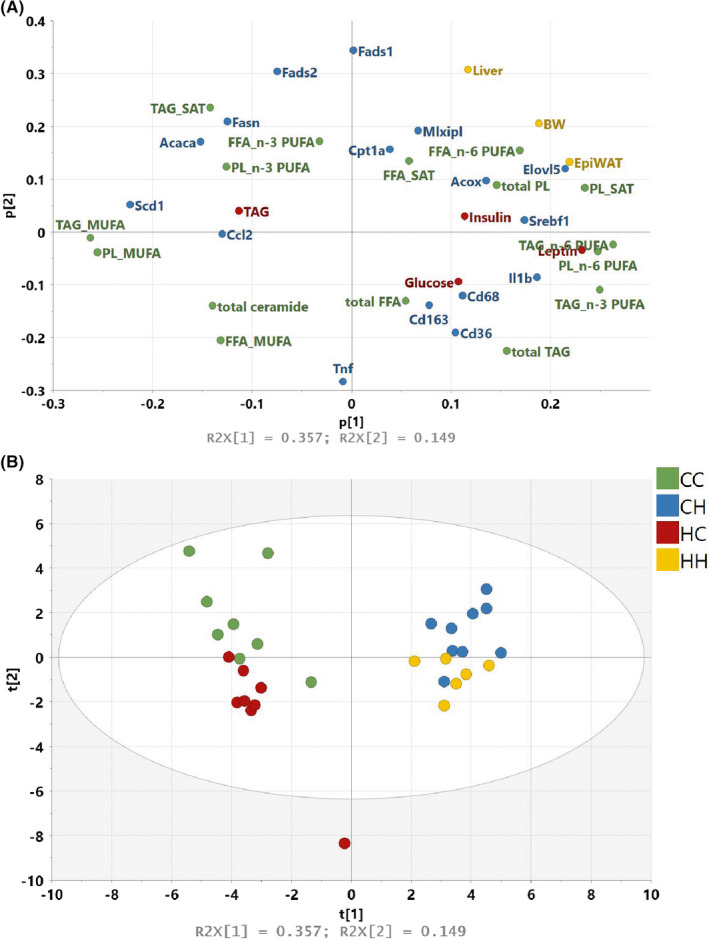
Figure 3.

PCA analysis of all data from male offspring at 4 wk of age. A, The loading plot contains all data included in the analysis. Parameters are coloured according to data origin: yellow, body and organ weights; red, plasma markers; green, hepatic lipid profile; blue, hepatic gene expression. B, The score plot demonstrates how the male offspring separate according to their overall metabolic profile (CC, n = 8; CH, n = 9; HC, n = 8; HH, n = 6)
