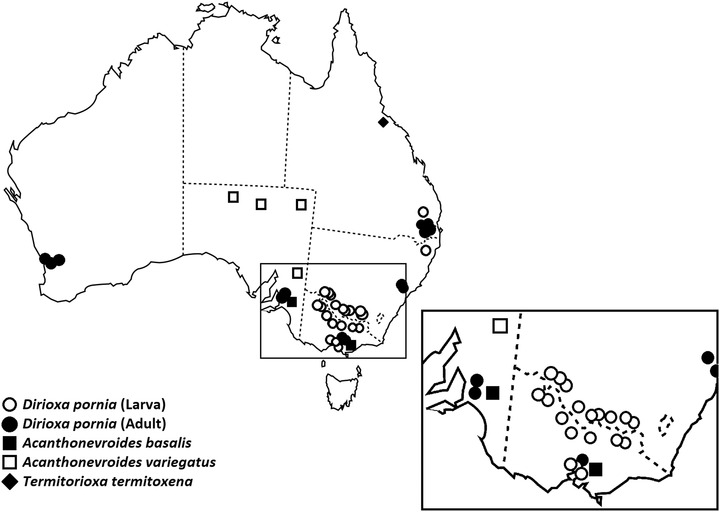
Fig. 4.

Distribution of the fly adults and larvae included in this study (examined for molecular and/or morphological variation). Each dot represents the location where one or more specimens were collected. For number of specimens from each location see Table S1.
