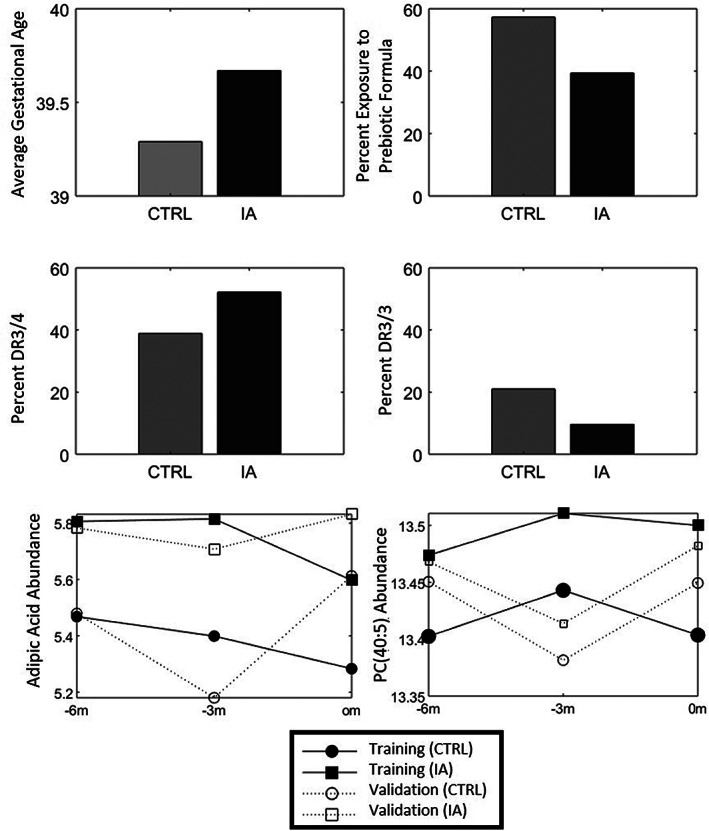
FIGURE 4.

Data graphs showing the directional changes of (A) gestational age, (B) exposure to prebiotic formula, (C) DR3/4 and (D) DR3/3, as well as the temporal changes for (E) adipic acid and (F) phosphotidycholine PC(40:5) for the IA and associated control samples (CTRL)
