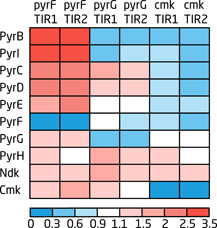
Figure 3.

Heatmap of the fold‐change of protein levels in the pyrimidine biosynthesis pathway of the CRISPRi‐induced pyrF, pyrG, and cmk growth decoupling strains expressing psdAb‐TIR1 and psdAb‐TIR2. Fold‐change for the growth decoupling strains was calculated by dividing the CRISPRi‐induced pyrF, pyrG, and cmk strains with the respective (TIR1 or TIR2) CRISPRi‐induced control strain harboring the sgRNA control plasmid. The data can be found in Table S3. CRISPRi, CRISPR interference [Color figure can be viewed at wileyonlinelibrary.com]
