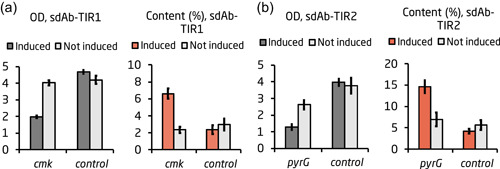
Figure 5.

sdAb production in small‐batch fermentation. (a) Growth and sdAb production after 24 hr for strains harboring psdAb‐TIR1 and the cmk sgRNA plasmid. (b) Growth and sdAb production after 24 hr for strains harboring psdAb‐TIR2 and the pyrG sgRNA plasmid. Cultures, where the CRISPRi system was induced, are shown in the dark gray (OD), red (sdAb content). Uninduced cultures are shown in bright gray. The values were calculated as an average of three biological replicates. Error bars represent standard deviation of the replicates. CRISPRi, CRISPR interference; OD, optical density; sdAb, single‐domain antibody [Color figure can be viewed at wileyonlinelibrary.com]
