Figure 2.

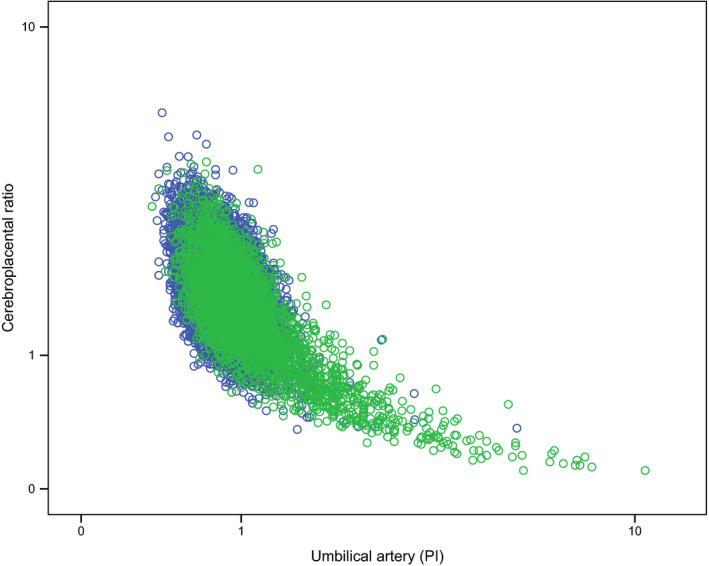
Scatter plot of cases with adverse outcome (green dots; n = 3423) and cases without adverse outcome (blue dots; n = 15 308) with their respective UA PI values (x‐axis, logarithmic) and CPR values (y‐axis, logarithmic).

Scatter plot of cases with adverse outcome (green dots; n = 3423) and cases without adverse outcome (blue dots; n = 15 308) with their respective UA PI values (x‐axis, logarithmic) and CPR values (y‐axis, logarithmic).